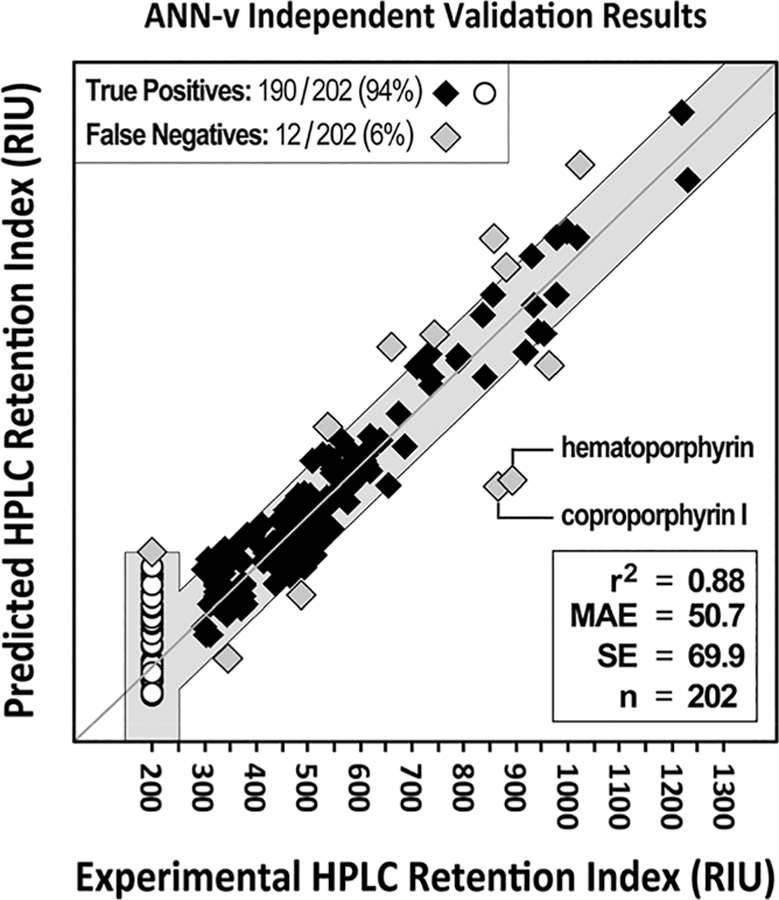
Figure 5.

ANN-v independent validation set prediction results for 202 human endogenous compounds. The shaded gray area represents the region of true positive predictions based on the ±2SE filter window of 203 RIU from the ANN-v validation set statistics and the lower QRI cutoff. Points inside the gray area are the true positive predictions (black diamond and white circles). Points outside the gray area are the false negative predictions (gray diamonds). The worst predictions are for two porphyrins; coproporphyrin I AE = 305 RIU, and hematoporphyrin AE = 320 RIU. The MAE and SE are significantly worse than for the validation set data. Much of this difference is due to the two poorly predicted porphyrins. Sensitivity is close to the 95% that would be expected with the ±2SE filter range.
