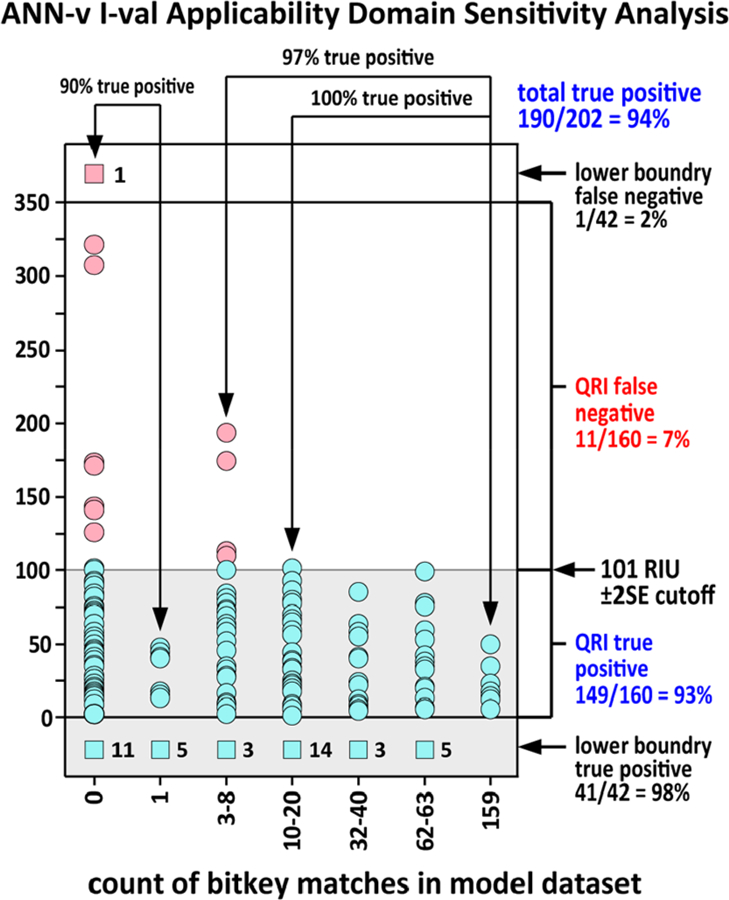
Figure 7.

ANN-v bitkey applicability domain analysis for the 202 compound human endogenous metabolite i-val set. The x-axis groups compounds by the number of bitkey matches in the model data set. Prediction absolute error is shown on the y-axis. Green dots in the shaded area are true positive predictions based on the ±2SE filter range. Red dots above the sensitivity cutoff are false negative predictions. The ±2SE sensitivity cutoff is marked on the right. Compounds represented by green boxes at the bottom are true positive predictions for compounds below the QRI lower boundary. The number of true positive predictions is given in the number to the right of the box. The red box at the top of the plot, column 0, represents a false negative prediction for a compound outside the QRI lower boundary. The ANN-v model showed an overall sensitivity of 94%. Sensitivity was 97% when there were three or more compounds in the model data with a bitkey matching the predicted compound and 90% where there were two or fewer compounds in the model data with a matching bitkey.
