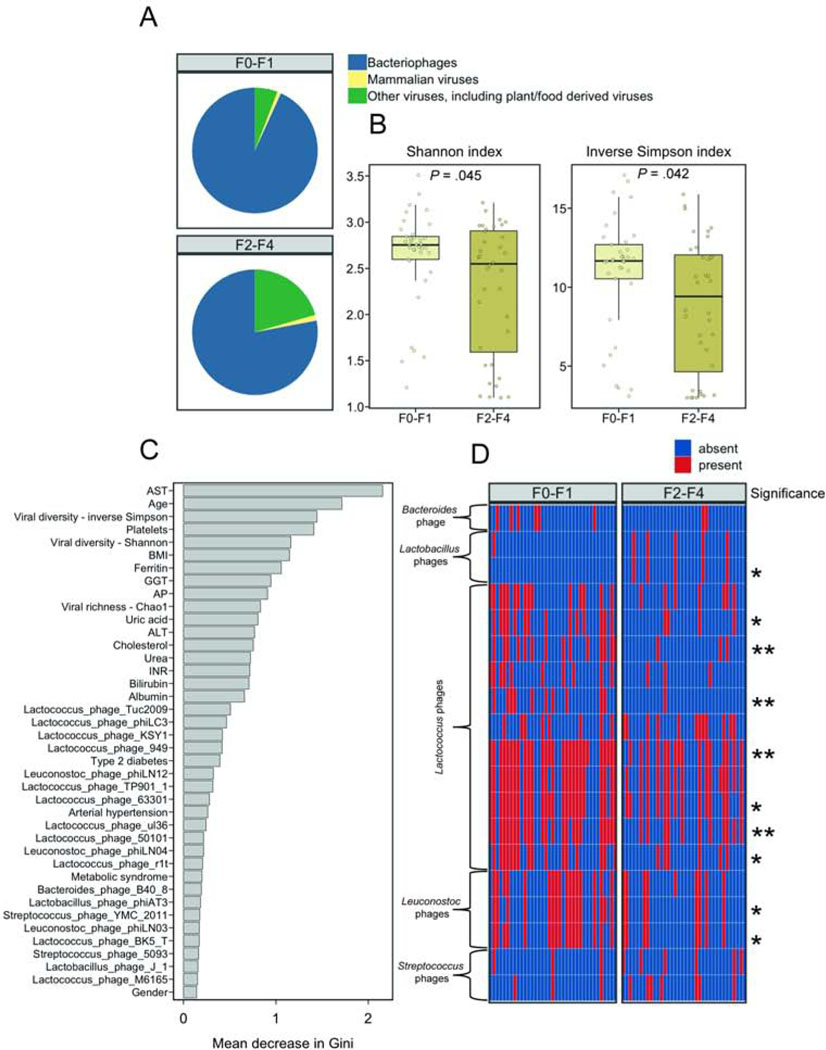
Figure 4. Altered fecal virome composition in patients with NAFLD and fibrosis.
(A) Mean relative abundance of intestinal bacteriophages (phages), mammalian viruses, and other viruses, calculated at the family level, in fecal samples from patients with NAFLD and F0–F1 fibrosis or patients with NAFLD and F2–F4 fibrosis. (B) Viral diversity based on the Shannon and inverse Simpson indices. (C) Random Forest feature selection including the presence/absence of viral taxa at species level together with selected clinical features to discriminate NAFLD F0–F1 from NAFLD F2–F4. (D) Presence/absence heatmap of the relative abundance of viral taxa among the top 40 features identified in Random Forest feature selection. Stars on the right side of the panel indicate significance whereas one star (*) denotes an adjusted P value equal or below .05 but higher than .01, two stars (**) denote an adjusted P value equal or lower than .01 but higher than .001. Unadjusted and P values adjusted for proton pump inhibitor use can be found in Supplementary Table 3. In panel A–D, 37 patients were staged as F0–F1 fibrosis and 36 patients were staged as F2–F4 fibrosis. ALT, alanine aminotransferase; AST, aspartate aminotransferase; AP, alkaline phosphatase; BMI, body mass index; GGT, gamma-glutamyl-transferase; INR, international normalized ratio; HDL, High-density lipoprotein; LDL, Low-density lipoprotein.

