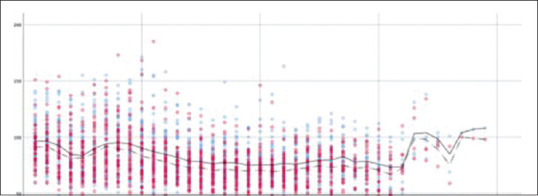
Figure 3.

All invasively measured MAP values and all noninvasively measured MAP values over the time of registration. Blue = invasive MAP, red = noninvasive MAP; solid interpolation line: invasive MAP, dashed interpolation line: noninvasive MAP. X-axis: time (t) in minutes, Y-axis: MAP (mmHg). The dynamics are well mapped by ClearSight™, the difference of the MAP of the two measurement methods is visible
