Figure 2.
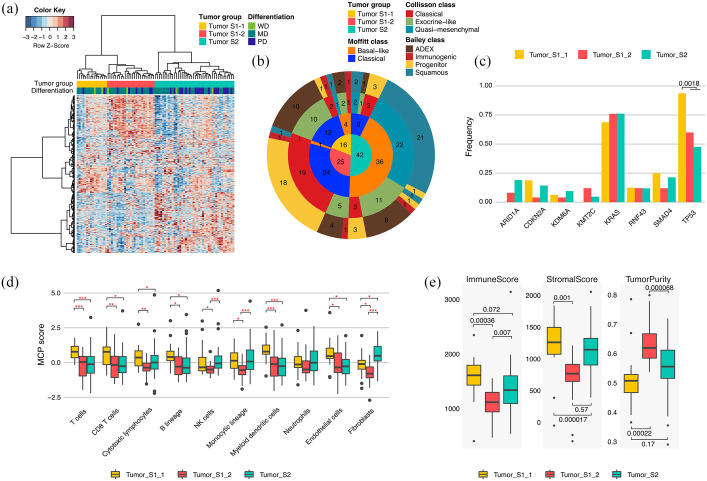
Tumor-specific transcriptomic subgroups in PDAC. (a) Unsupervised HC of 83 PDAC tumor tissues based on gene expression profiling; 399 tumor-specific genes with SD > 1 were used in this clustering. Bars at the top of a heat map represent HC-based tumor groups (top) and tumor differentiation grade (bottom). (b) Pie chart showing the number of samples in HC-based PDAC groups (inner circle), Moffitt subtypes (second inner ring), Collisson subtypes (third inner ring), and Bailey subtypes (outer ring). (c) Alteration frequency of each HC-based tumor group for genes altered in >4 PDAC patients (p-value: Fisher’s exact test). (d) Z-normalized MCPcounter scores among HC-based tumor groups. Z-normalization was performed across the tumor samples for each cell marker in the tumor microenvironment. Statistically significant differences in scores among the tumor groups are indicated by red asterisks (*p < 0.05, **p < 0.01, ***p < 0.001, Student’s t test). (e) Immune scores (left panel), stromal scores (middle panel), and tumor purities (right panel) in HC-based tumor groups (p-value: Student’s t test). ESTIMATE calculated the scores and tumor purities based on gene expression profiling.
HC, hierarchical clustering; MD, moderately differentiated; PDAC, pancreatic ductal adenocarcinoma; PD, poorly differentiated; SD, standard deviation; WD, well differentiated.

