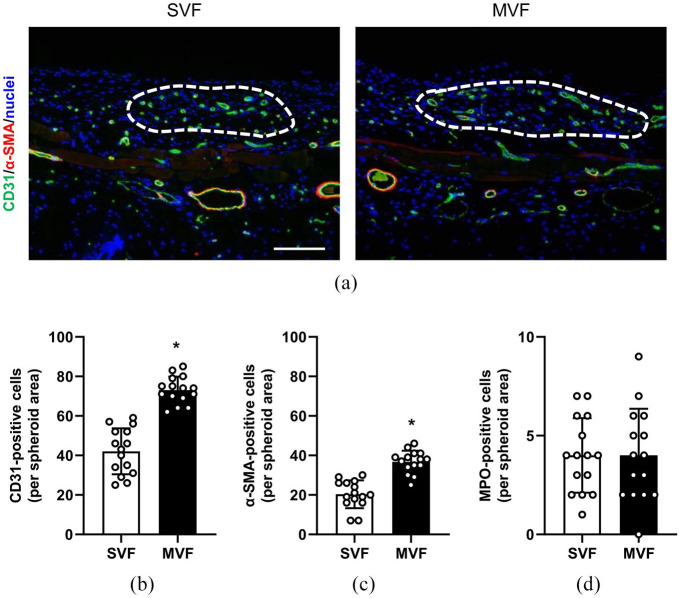
Figure 5.
Immunohistochemical analyses of transplanted spheroids: (a) immunofluorescence stainings of CD31 (green) and α-SMA (red) within transplanted SVF and MVF spheroids (borders marked by broken white lines) on day 10 after transplantation into dorsal skinfold chambers. Cell nuclei are stained with Hoechst 33342 (blue). Scale bar: 50 µm, (b, c) quantitative analyses of CD31- (b) and α-SMA-positive cells (c) (in % of all Hoechst 33342-positive spheroid cells per spheroid area) within the SVF and MVF spheroids of immunohistochemical sections. Mean ± SD (n = 15). *p < 0.05 versus SVF, and (d) quantitative analysis of MPO-positive cells (in % of all spheroid cells per spheroid area) within the SVF and MVF spheroids of immunohistochemical sections. Mean ± SD (n = 15).

