Figure 1:

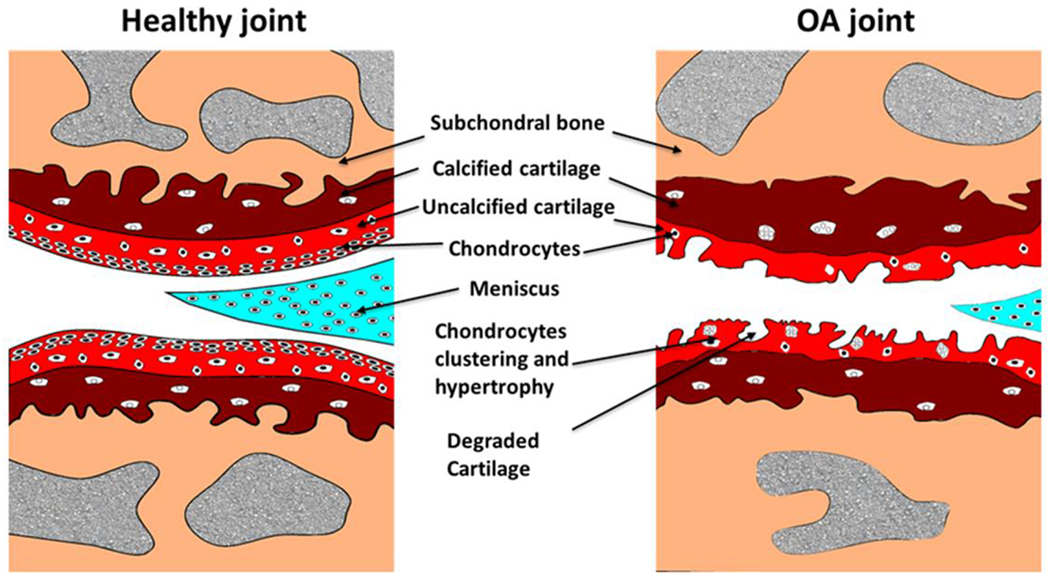
Schematic representation of normal and OA knee joint. The healthy joint (on left) has smooth cartilage surface with normal chondrocyte distribution and OA joint shows cartilage degeneration and subchondral bone changes.

Schematic representation of normal and OA knee joint. The healthy joint (on left) has smooth cartilage surface with normal chondrocyte distribution and OA joint shows cartilage degeneration and subchondral bone changes.