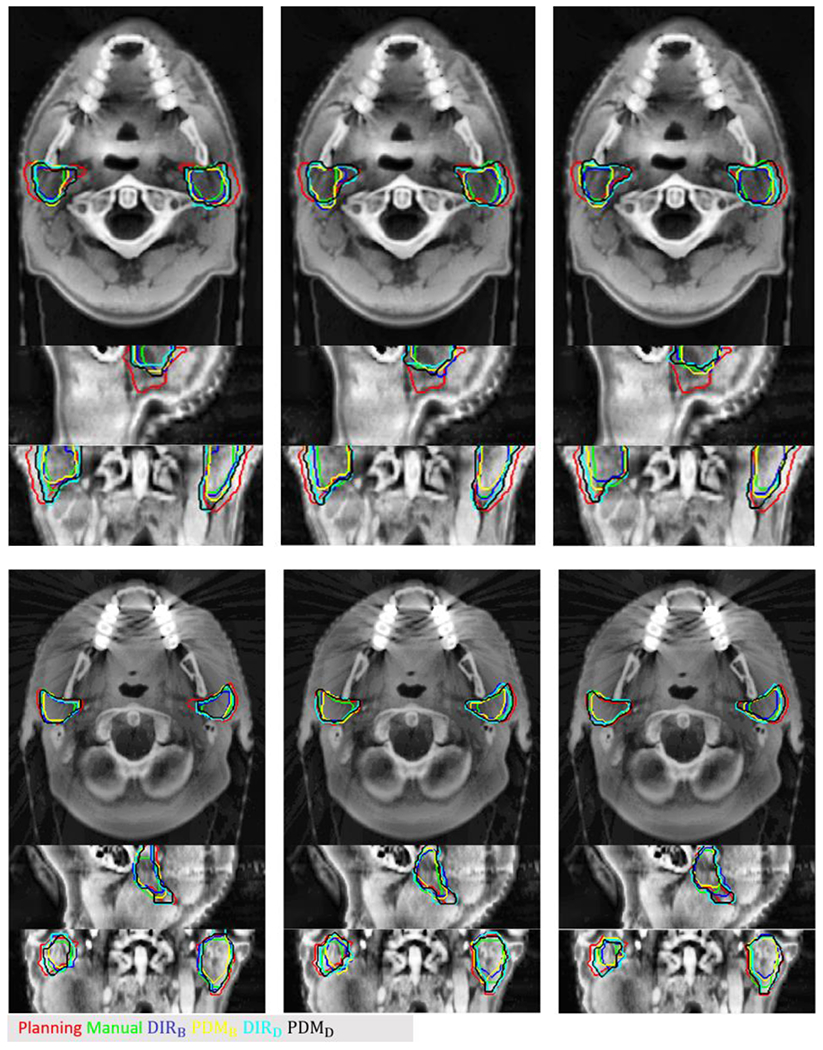
Figure 3.

Two examples of testing cases. Red contour is the planning contour, the green contour is the manual contour at weekly CBCT, the blue and cyan contour is propagated contour by B-spline, and Demon and yellow (PDMB) and black contour (PDMD) are predicted contours by the trained model with B-spline and Demon DFs, respectively
