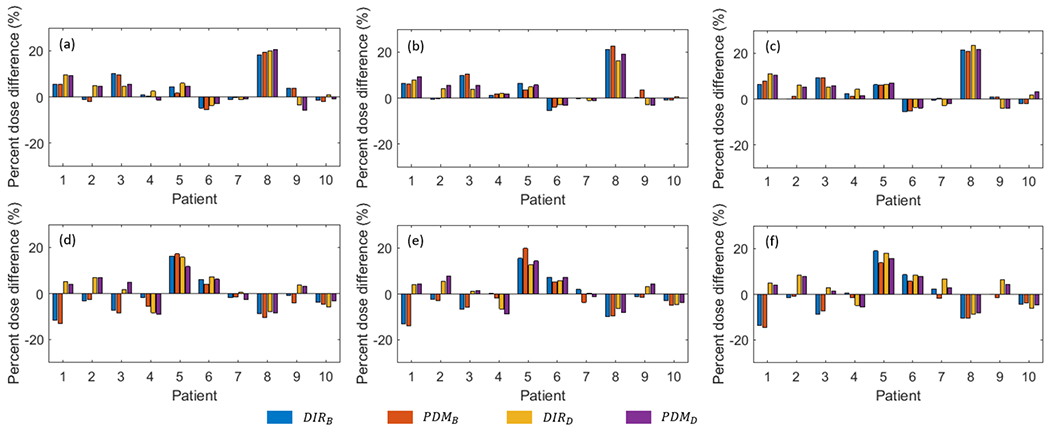
Figure 7.

The percent mean dose difference (%ΔDmean) of each patient. (a-c) are %ΔDmean of the ipsilateral parotid gland, and (d-f) are %Dmean of the contralateral parotid gland. The first column is %ΔDmean at week 4 accumulated dose, the second column is week 5 and the third column is week 6.
