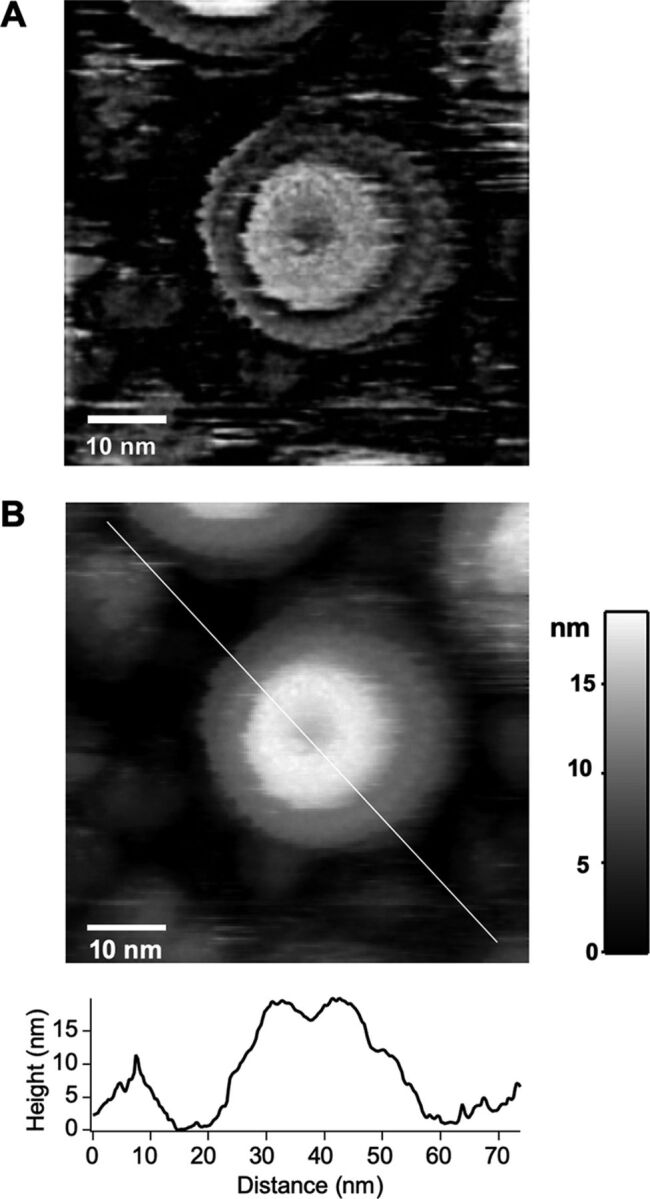
FIG 5.

AFM image of the purified Vibrio MS-ring. (A) A filtered AFM image of the purified Vibrio MS-ring. A raw AFM image is shown in panel B. To obtain the filtered AFM image, a raw AFM image was filtered by a band-pass filter with high and low cutoff frequencies of 1/12.0 nm−1 and 1/1.2 nm−1, respectively. (B) A raw AFM image of the purified Vibrio MS-ring. A cross-section profile along the white line in the AFM image is shown in the bottom panel.
