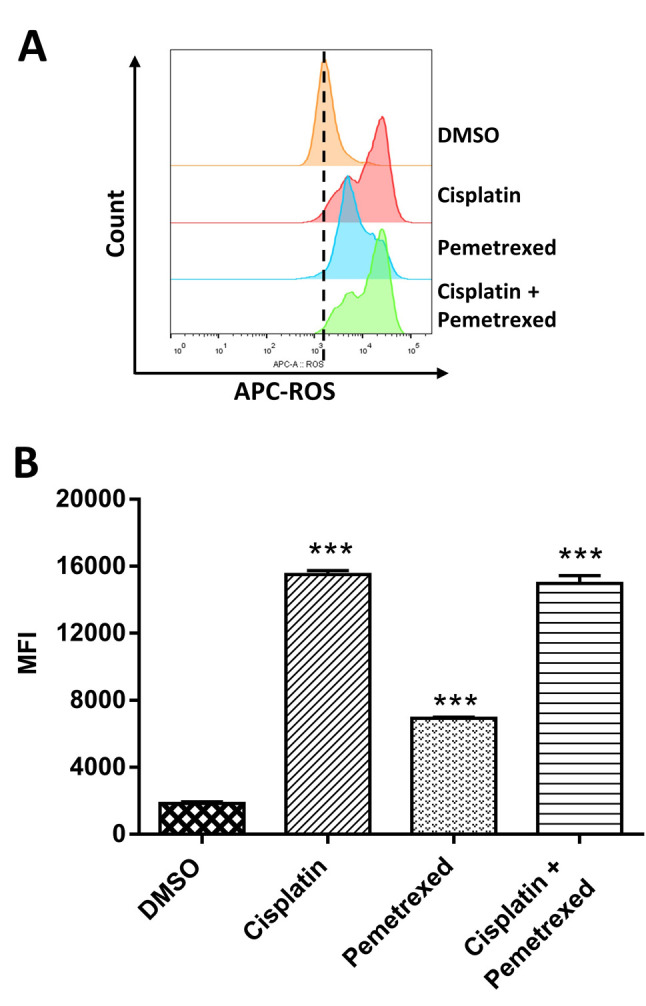
Figure 2. The effect of cisplatin and pemetrexed on reactive oxygen species (ROS) production. A: A549 cells were incubated with cisplatin (200 nM) and pemetrexed (100 nM) alone and in combination for 72 h and then stained with ROS deep-red dye. The fluorescent signal was evaluated by flow cytometry, and the median fluorescence intensity (MFI) was determined. The histogram indicates the ROS levels after drug treatment. B: The bar diagram shows the quantification of ROS production. The results are presented as the mean±SD from three independent experiments. ***Significantly different at p<0.001 vs. control by one-way analysis of variance followed by Dunnett’s multiple comparison test.

