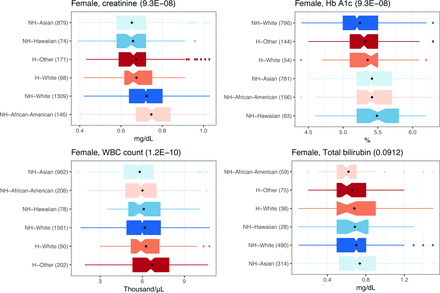
Fig. 2. Difference in laboratory test measurements among healthy individuals in different SIRE groups.

Distributions of different laboratory tests in healthy individuals for (A) creatinine, (B) Hb A1c, (C) WBC count, and (D) total bilirubin. Black diamonds: average values. Parentheses in the titles show Benjamini–Hochberg-adjusted ANOVA P values. Parentheses next to each SIRE, show the number of healthy individuals. Colors match across panels. SIRE sorted by mean. H, Hispanic or Latino; NH, Not Hispanic or Latino.
