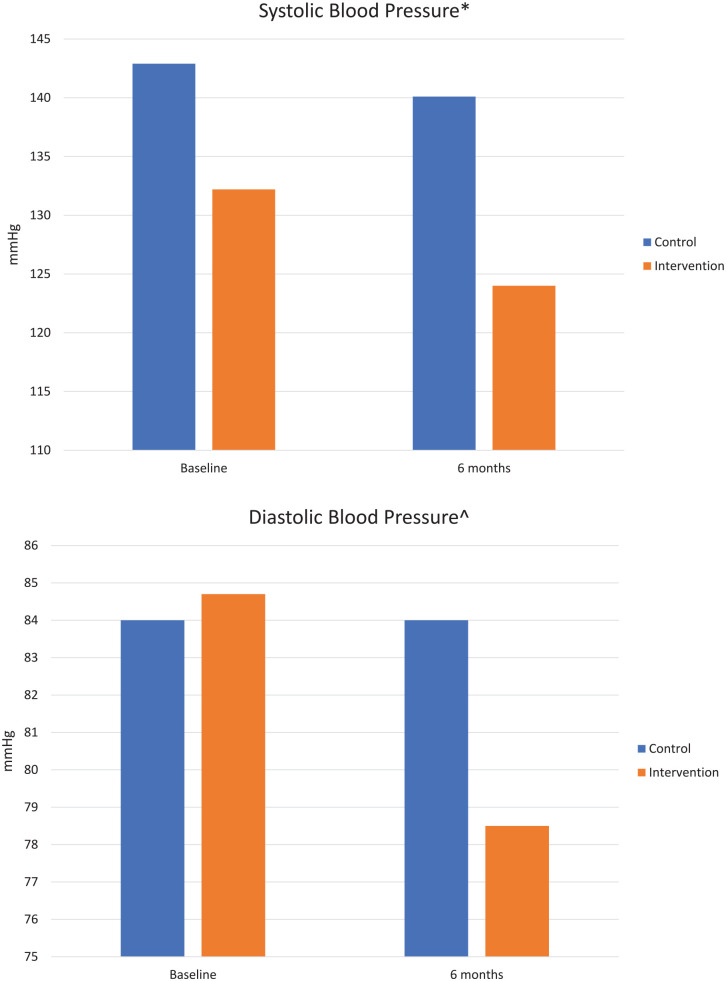
Figure 3.
Blood pressure results (n = 28).
* P = .35 for the comparison of systolic blood pressure change from baseline to 6 months, calculated using an independent samples t test.
^ P = .06 for the comparison of diastolic blood pressure change from baseline to 6 months, calculated using an independent samples t test.

