FIG. 5.
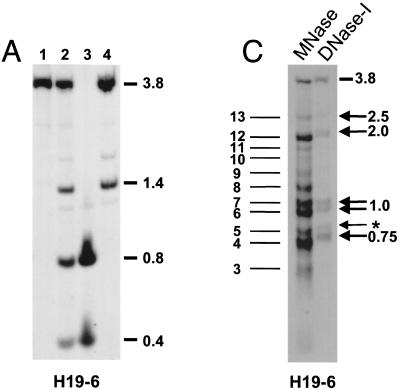
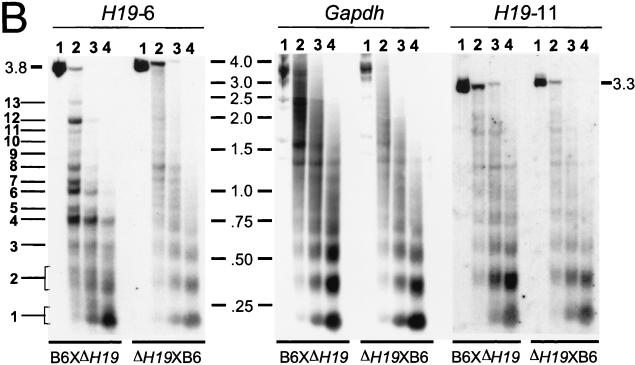
Allele-specific MNase digestion in the brain. (A) Unaltered DNA methylation in brain samples from 1-week-old mice that were hemizygous for a 13-kb deletion comprising the H19 gene and 10 kb of upstream sequences (ΔH19 [31]). Lanes: 1, SacI-digested brain DNA of a C57BL/6 mouse; 2, SacI-HhaI-digested C57BL/6 brain DNA; 3, SacI-HhaI-digested (C57BL/6 × ΔH19)F1 brain DNA; 4, SacI-HhaI-digested (ΔH19 × C57BL/6)F1 brain DNA. Hybridization was with probe H19-6. The 0.4- and 0.8-kb bands are indicative of complete HhaI digestion (absence of DNA methylation); the 1.4-kb band indicates an HhaI restriction site that is partially methylated on the paternal chromosome. (B) MNase digestions on nuclei extracted from brains of 1-week-old mice that were hemizygous for ΔH19. B6XΔH19 corresponds to (C57BL/6 × H19)F1, and ΔH19XB6 corresponds to (ΔH19 × C57BL/6)F1. Lanes 1 to 4 correspond to 0, 30, 60, 120 s of incubation with MNase, respectively. DNA was digested with SacI, and hybridization was carried out with H19-6, H19-11, and a Gapdh probe. Fragment sizes were determined as explained in the legend to Fig. 2. Maternal MNase bands are numbered 1 to 13 starting from the mononucleosomal band. The estimated sizes of bands 4 to 13 are 0.7, 0.8, 0.95, 1.05, 1.25, 1.4, 1.6, 1.8, 2.0, and 2.5 kb, respectively. (C) Comparison of MNase and DNase I digestion profiles. The left-hand lane shows the same MNase digestion as shown in panel B (lane 2, B6XΔH19); the right-hand lane shows a DNase I digestion on the same nuclei. Arrows indicate DNase I HS sites with their size in kilobases to the right. The weak DNase I site indicated with an asterisk was clearly detectable only in brain tissue. No DNase I HS sites were detected in tissues from (ΔH19 × C57BL/6)F1 mice (results not shown).


