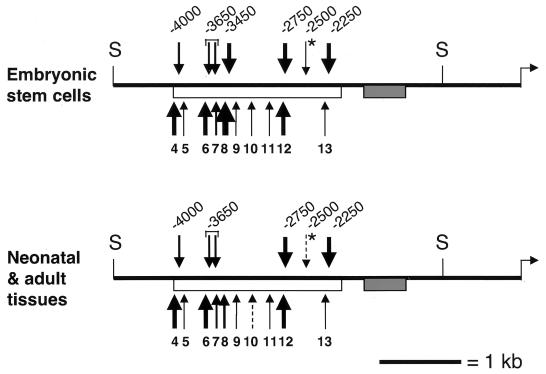
FIG. 7.
Summary maps of maternal MNase and DNase I sensitivity in ES cells and tissues (liver, brain, and kidney). Vertical arrows above the lines indicate maternal DNase I HS sites identified in this study; the thickness reflects their prominence in the material analyzed. For each DNase I HS site, the nucleotide position relative to the H19 transcription initiation site (horizontal arrow) is indicated. All HS sites map within the core region of paternal DNA methylation (open bar [53, 57]). The HS site marked with an asterisk was visible in ES cells but barely detectable in adult tissues. Vertical arrows below the line indicate the maternal chromosome-specific MNase digestion sites within the paternally methylated region (numbering is as in Fig. 5 and 6). SacI sites (S) are indicated; the shaded bar indicates a 461-bp G-rich region with 32 copies of a 9-bp repeat sequence (26, 52).

