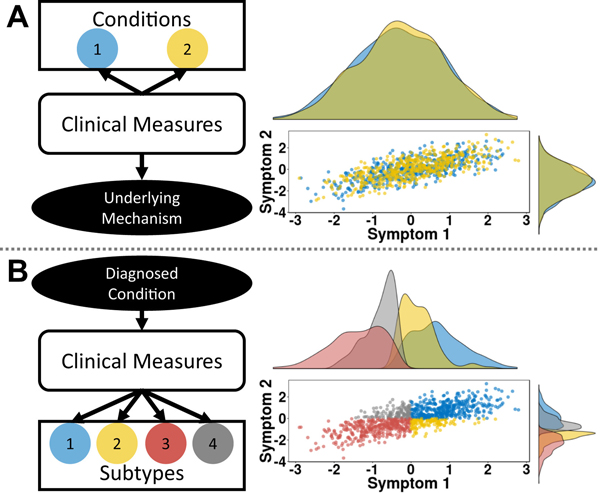
Figure 1.
Illustration of two problems that emerge from the homogeneity assumption. (A) The comorbidity problem occurs when a common mech- anism may underlie two different conditions and can be inferred from the relationship between measures. The interaction between two symptoms is plotted on the left and colored by different diagnosed conditions (blue and yellow). Axis represent symptom z scores for simplicity. The histograms show that the symptoms do not distinguish between the conditions, sug- gesting that the observed clinical features may reflect a common underlying mechanism. (B) The heterogeneity problem occurs when multiple underlying mechanisms may drive a given condition. The interaction between two symptoms is plotted on the left. Axes represent symptom z scores. Here, different subtypes (blue, yellow, red, gray) can emerge that may vary inde- pendent of the interaction between measures. The histograms show that the subtypes relate to each other in different ways. Subtypes 1 and 2 show overlapping distributions for symptom 1, as do subtypes 3 and 4. However, for symptom 2, subtypes 1 and 4 overlap, as do subtypes 2 and 3.

