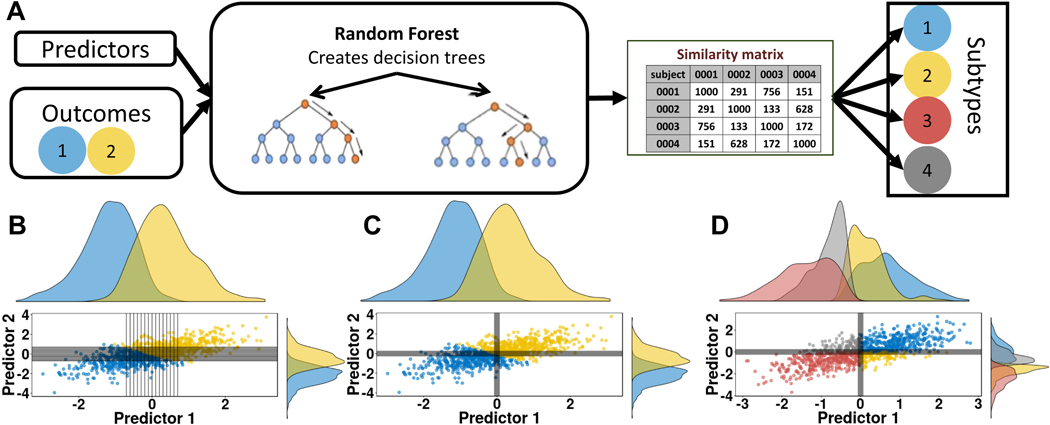
Figure 4.
(A) Schematic of the functional random forest approach. A random forest model is used to predict outcomes. Depending on the question (e.g., by selecting transdiagnostic outcomes and/or clinical measures) the random forest model itself can test for a common underlying mechanism and, therefore, account for comorbidity. If the model is valid, a similarity matrix is generated from the random forest model and can be used to identify subtypes in the same or an independent dataset. (B) A scatter visualization of two predictors represented as z scores. Color reflects outcome. Each tree within the forest creates a rule for each predictor, shown in black lines. (C) The same scatter shows the average decision made across the random forest, which separates the two outcomes. Participants within the same quadrant are more similar than in different quadrants. (D) A scatter of predictors from an independent cohort, where participants are coded by identified subtype.

