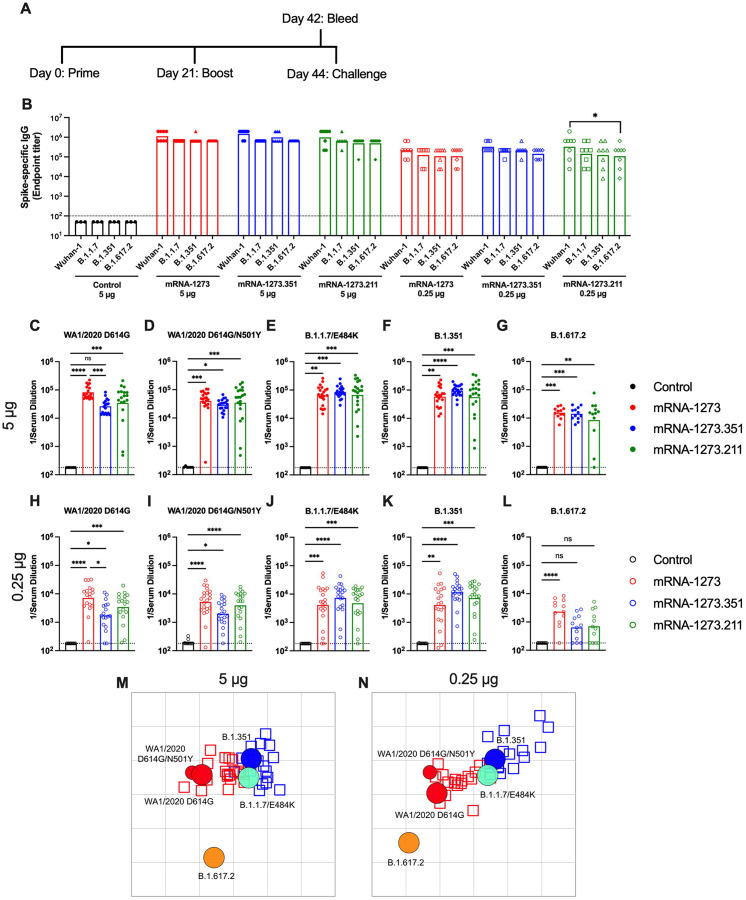
Figure 1. Immunogenicity analysis of mRNA vaccines in 129S2 mice.
Seven to nine-week-old female 129S2 mice were immunized and boosted with 5 or 0.25 μg of mRNA vaccines. A. Scheme of immunizations, blood draw, and virus challenge. B. Serum anti-spike IgG responses at three weeks after booster immunization with mRNA vaccines (control (black symbols), mRNA-1273 (red symbols), mRNA-1273.351 (blue symbols), and mRNA-1273.211 (green symbols) against indicated spike proteins (Wuhan-1, B.1.1.7, B.1.351, or B.1.617.2) (n = 3 (control vaccine) or 8 (spike vaccines), two independent experiments, boxes illustrate mean values, dotted line shows the limit of detection (LOD); two-way ANOVA with Tukey’s post-test: *, P < 0.05). C-L. Serum neutralizing antibody responses three weeks after boosting as assessed by FRNT (half-maximal reduction, FRNT50 values) with WA1/2020 D614G (C, H), WA1/2020 D614G/N501Y (D, I), B.1.1.7/E484K (E, J), B.1.351 (F, K), or B.1.617.2 (G, L) in mice immunized with 5 (C-G) or 0.25 (H-L) μg of control (n = 6–10), mRNA-1273, mRNA-1273.351, or mRNA-1273.211 (n = 12–21) vaccines (two independent experiments, boxes illustrate geometric mean values, dotted line shows LOD; one-way Kruskal-Wallis ANOVA with Dunn’s post-test: *, P < 0.05; **, P < 0.01; ***, P < 0.001; **** P < 0.0001). M-N. Antigenic map of sera from 129S2 mice titrated against WA1/2020 D614G, WA1/2020 N501Y/D614G, B.1.1.7/E484K, B.1.351, and B.1.617.2. The maps show sera from mice that received 5 μg (M) or 0.25 μg (N) doses, respectively. Antigens (viruses) are shown as circles (WA1/2020 D614G: red, bigger circle, WA1/2020 N501Y/D614G: red, smaller circle, B.1.1.7/E484K: turquoise, B.1.351: blue, and B.1.617.2: orange) and sera as squares (blue for mRNA-1273.351-induced sera and red for mRNA-1273-induced sera). The X and Y axes correspond to antigenic distance, with one grid line corresponding to a two-fold serum dilution in the neutralization assay. The antigens and sera are arranged on the map such that the distances between them best represent the distances measured in the neutralization assay.

