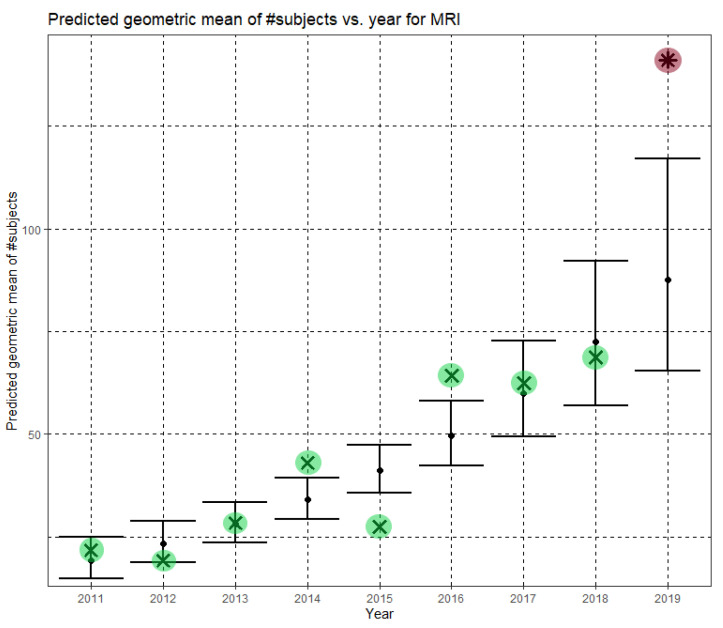
Figure 4.
Phase I—Predicted geometric mean (black dots) and confidence intervals of dataset sizes in MICCAI articles involving MRI for the years 2011–2019, based on the whole ensemble of 2011–2018 MRI dataset sizes. The empirical geometric means (2011–2018) are shown (in green) for comparison (x marks). The empirical geometric mean for 2019 (in purple) became available later, in Phase II of this research.

