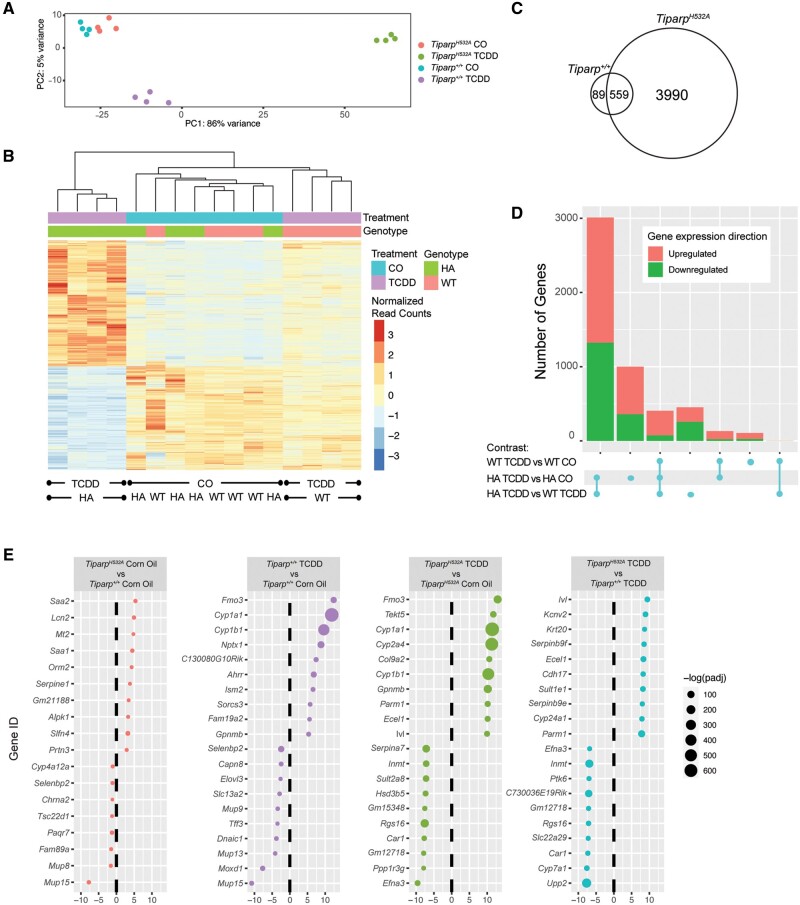
Figure 8.
Hepatic gene expression profiling in TCDD-treated TiparpH532A compared with Tiparp+/+ mice. A, Principal component analysis of all samples. B, Heat map displaying the relative expression levels in each sample for all significant genes.a Genes and individual samples are arranged by hierarchical clustering. Treatment group and genotype are indicated with colored bars at the top of the heatmap and represented as normalized read counts, or reads per kilobase of transcript per million reads mapped. C, Venn diagram of differentially regulated TCDD-induced hepatic genes in Tiparp+/+ and TiparpH532A mice treated for 6 days.b D, An upset plot showing the number of differentially expressed genesb in common between genotype or treatment group contrasts. On this graph, each row corresponds to a contrast, while each column corresponds to an intersection between contrasts. Circles connected by lines indicate the participation of the indicated contrasts in the intersection. E, The top 10 upregulated and top 10 downregulated differentially expressed genes,b grouped by treatment or genotype contrast. Genes are listed by their MGI gene symbol and ranked by fold change.aFor this analysis, significant genes are those that have an adjusted p value < .05 for the TiparpH532A TCDD versus TiparpH532A CO contrast. bGenes are considered to be differentially expressed if they have an absolute linear fold change ≥ 2 and an adjusted p value < .05. Abbreviations: TCDD, 2,3,7,8-tetrachlorodibenzo-p-dioxin; CO, corn oil; WT, wildtype (Tiparp+/+); HA, H532A (TiparpH532A).

