Figure 9.
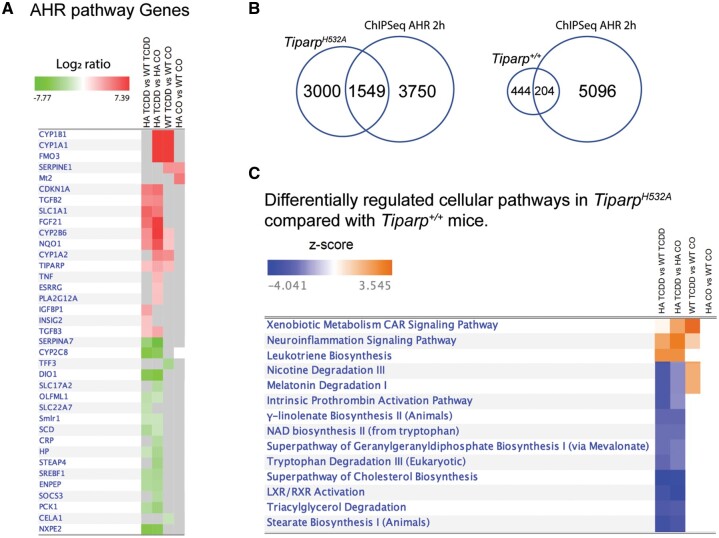
Aryl hydrocarbon receptor (AHR) gene battery and ingenuity pathway analysis (IPA) of hepatic gene expression changes in 2,3,7,8-tetrachlorodibenzo-p-dioxin (TCDD)-treated TiparpH532A compared with Tiparp+/+ mice. A, Heatmap of the significant differentially expressed genesa for selected genes within the IPA AHR pathway, for all contrasts. Red represents upregulated genes and green represents downregulated genes. Gray squares represent genes that did not meet our critical adjusted p value cutoff (<.05). For the full gene list please see Supplementary Table 6. B, Venn diagram of the overlap in the number of hepatic genes changed in TCDD-treated TiparpH532A or Tiparp+/+ compared with TCDD-induced hepatic AHR-bound regions from (Dere et al., 2011). C, Canonical pathway analysis of the differentially expressed genesa for all contrasts. Filters for this analysis were set to z-score ≥ absolute 2.2 and Benjamini-Hochberg adjusted p value ≤ .05. Blue represents inhibited pathways and orange represents activated pathways. This figure was trimmed for presentation; for the full gene list please see Supplementary Table 7. aGenes are considered to be differentially expressed if they have an absolute linear fold change ≥ 2 and an adjusted p value < .05.

