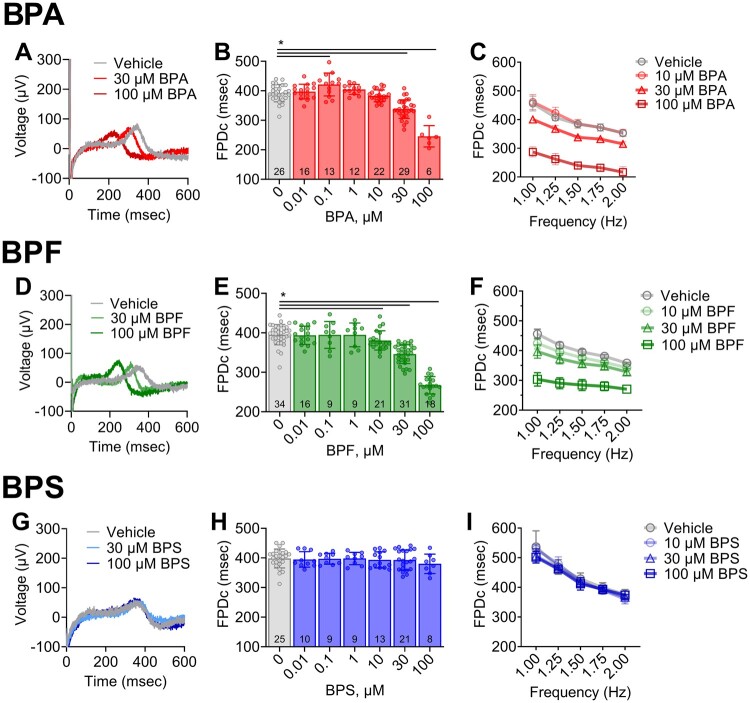
Figure 4.
Bisphenol chemical effects on cardiomyocyte field potential duration. A, Representative traces of extracellular field potentials recorded from hiPSC-CM following acute (15 min) exposure to vehicle, 30, or 100 µM BPA. B, Field potential duration (corrected using Fridericia formula: “FPDc”) shortens with increasing BPA exposure; single pacing frequency (1.5 Hz). C, FPDc restitution curve at multiple pacing frequencies (1–2 Hz). D, Local field potential traces following exposure to vehicle, 30, or 100 µM BPF. E, FPDc shortens with increasing BPF exposure (1.5 Hz). F, FPDc restitution curve (1–2 Hz). G, Local field potential traces following exposure 30–100 µM BPS. H, FPDc remains constant with increasing BPS exposure (1.5 Hz). I, FPDc restitution curve (1–2 Hz). Values reported as mean ± SD. *q < 0.05 as determined by ANOVA with multiple comparisons testing (0.1 FDR). Number of replicates indicated in each bar graph.

