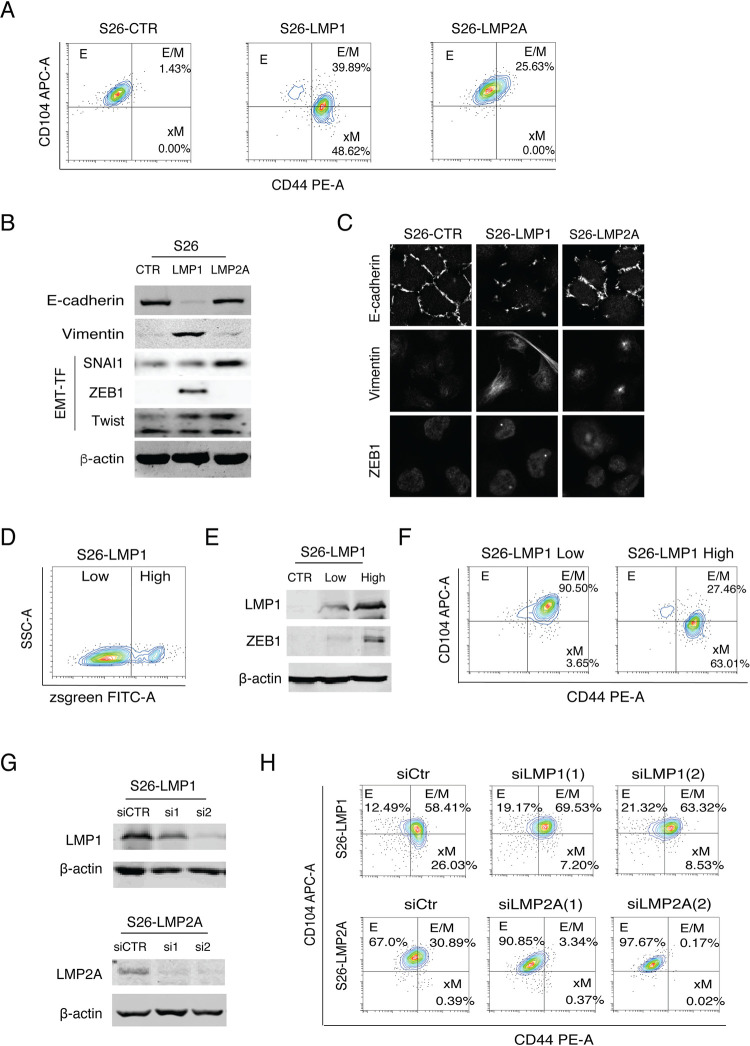
Fig 3. Effects of LMP1 and LMP2A expression on the generation of distinct subpopulations in the epithelial-mesenchymal spectrum.
(A) The changes of CD44 and CD104 profiles of S26 cells in response to LMP1 and LMP2A expression revealed by flow cytometry analysis. (B) The expression of EMT markers (E-cadherin, Vimentin) and EMT-TFs (SNAI1, Twist, ZEB1) in S26-CTR, S26-LMP1, and S26-LMP2A cells were analyzed by Western blot. β-actin was included as a loading control. (C) Immunofluorescence assay of S26 cells (S26-CTR) and S26 cells expressing LMP1 (S26-LMP1) or LMP2A (S26-LMP2A) cells for the expression and subcellular localization of E-cadherin, Vimentin, and ZEB1 (630x). (D) S26 cells were transfected with a pLVX-EF1α-IRES-Zsgreen1-LMP1 plasmid that simultaneously expresses LMP1 and Zsgreen from a single mRNA transcript. LMP1high and LMP1low subpopulations were separated and isolated by FACS based on the fluorescence intensity of Zsgreen. (E) The LMP1 and ZEB1 expression levels in these two subpopulations were analyzed by Western blotting. (F) The epithelial-to-mesenchymal states of LMP1high and LMP1low subpopulations were determined on their CD44 and CD104 expression profiles. (G) S26-LMP1 and S26-LMP2A cells were transfected siRNAs to knock down the expression of LMP1 and LMP2A respectively. The knockdown efficiency of siRNAs was analyzed by Western blot. (H) The effects of LMP1 and LMP2A knockdown on CD44 and CD104 profile were analyzed by flow cytometry analysis.

