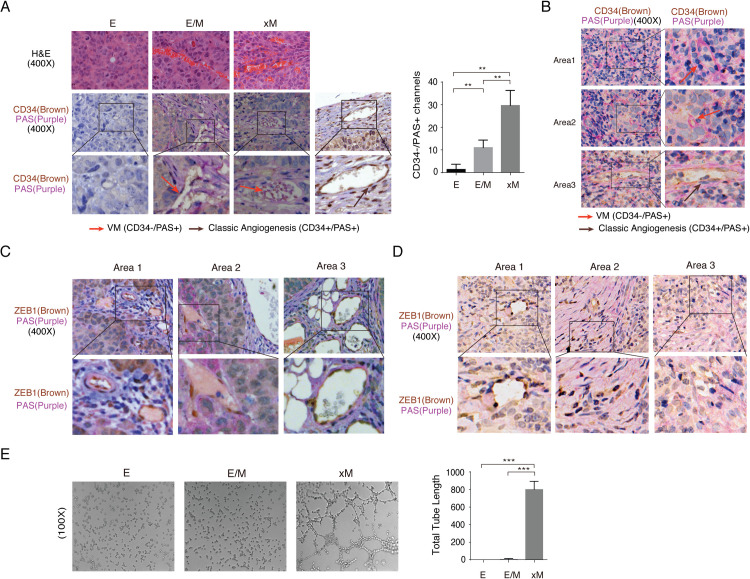
Fig 6. xM state cells are involved in vasculogenic mimicry (VM).
(A) Tumors formed by E, E/M, and xM cells were analyzed by H&E staining and IHC analysis for the CD34 (Brown) and PAS (Purple). Pink arrows indicate VM channels (PAS+/CD34-), brown arrows indicate classic angiogenesis (PAS+/CD34+), which is included as a control. Quantification of VM channels determined by microscopy with 400x magnification in randomly chosen fields (n = 3 per group, ** P<0.01). (B) NPC clinical samples were analyzed by IHC analysis for detecting VM channels, three representative areas in one case are shown. (C) The colocalization of ZEB1 (Brown) and PAS (Purple) in xM tumor, as well as NPC clinical sample (D). Images of three representative areas in one tumor sample are shown. (E) Vasculogenic mimicry of E, E/M, and xM cells was analyzed by Matrigel tube formation assay in vitro (Mean +/- SD of three biological replicates, *** P<0.001).

