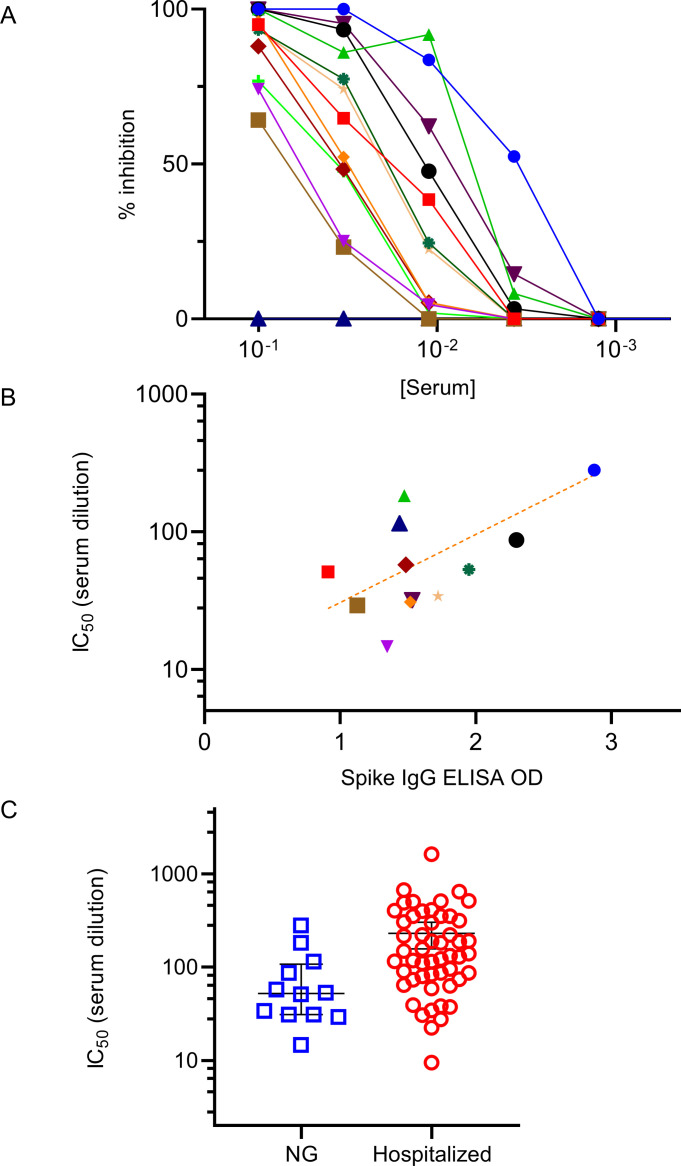
Fig 4. Neutralizing capacity of serum from individuals with mild/asymptomatic COVID-19, not requiring hospitalization.
(A) Serum was titrated in a live viral plaque assay to measure neutralization capacity (% inhibition of plaque formation) expressed on the Y axis vs. serum concentration (X-axis). Different color line/symbol represents data from a single subject with ID# shown in key in upper right, and negative control (blue triangles). (B) Correlation between the IC50 (Y-axis) and the spike IgG ELISA OD values (X-axis). Each symbol represents the average of replicate data points from a single individual in key above. r2 = .567 for the best fit trend line, log(y) = .495x + 0.991. (C) Comparison of serum neutralizing activity, IC50 (Y-axis) of the present National Guard troops (NG) vs. hospitalized study subjects recently published [21]. Each symbol represents data from a single subject’s serum titration. The mean and standard error for the different groups of study subjects is shown.

