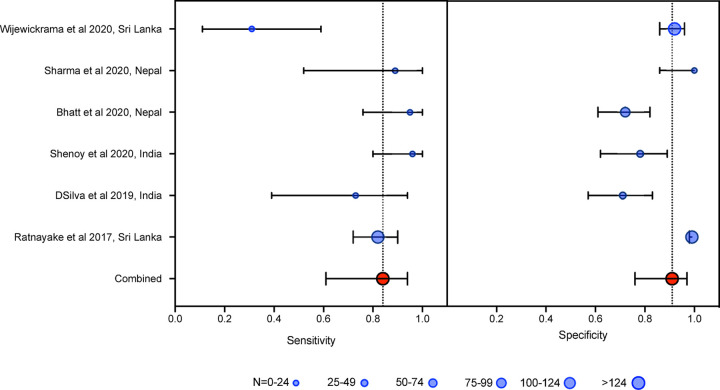
Fig 2. Forrest plot of 20WBCT sensitivity and specificity at detecting coagulopathy, Forrest plot of 20WBCT sensitivity and specificity at detecting coagulopathy defined as INR>1·4.
Studies displayed individually and pooled. Circle size is proportional to sample size, whiskers represent 95% confidence interval.

