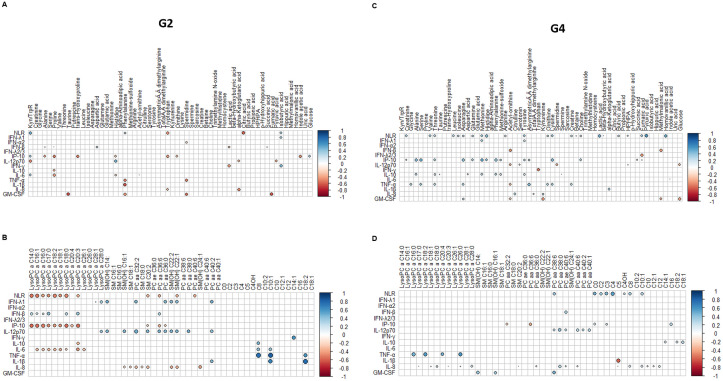
Fig 3. Patterns of correlations among all metabolites and cytokines/chemokines measured in the study.
(A) Correlation between metabolites and cytokines/chemokines/ neutrophil to lymphocyte ratio (NLR) in mild patients (G2). (B) correlation between lipids and cytokines/chemokines/NLR in critically ill patients (G2). (C) correlation between metabolites and cytokines/chemokines/NLR in mild patients (G4). (D) correlation between lipids and cytokines/chemokines/NLR in critically ill patients (G4). The correlations between the concentration levels of the metabolites and cytokines and chemokines were done by Spearman’s Correlation Coefficient using the R package “corrr”, correlations plots were done using the “corrplot” package. Each analysis and plot were done in R studio (1.3.959).

