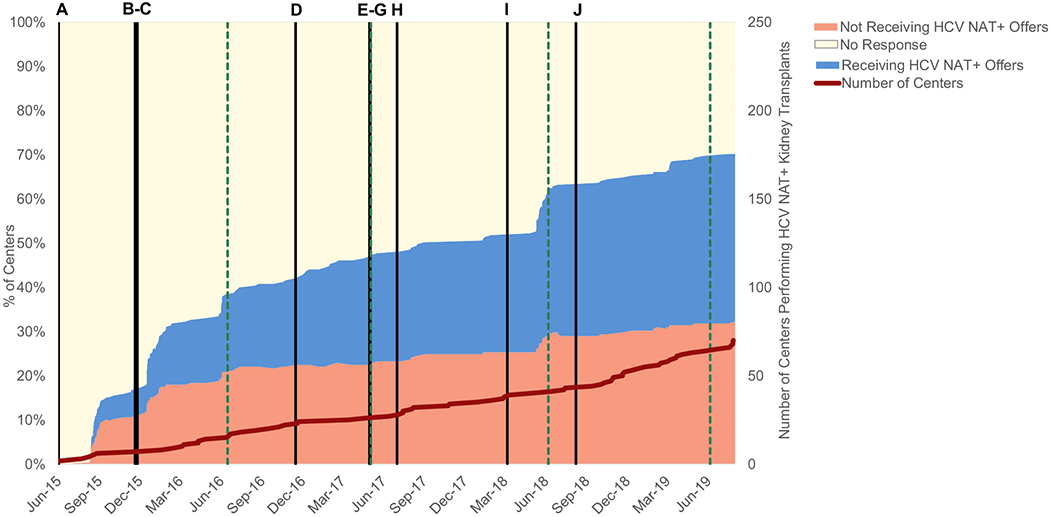
Figure 1.

Kidney transplant center responses to the HCV-NAT+ national offer filter over time. The colored areas represent proportions of centers opting to automatically bypass these offers, receive them, or with no response. Black vertical bars indicate the publication date of major studies (key in Table S1), and green vertical dashed bars indicate the date of the American Transplant Congress each year. The red line indicates the cumulative count of centers performing at least 1 kidney transplant from an HCV-NAT+ donor to an HCV-seronegative recipient.
