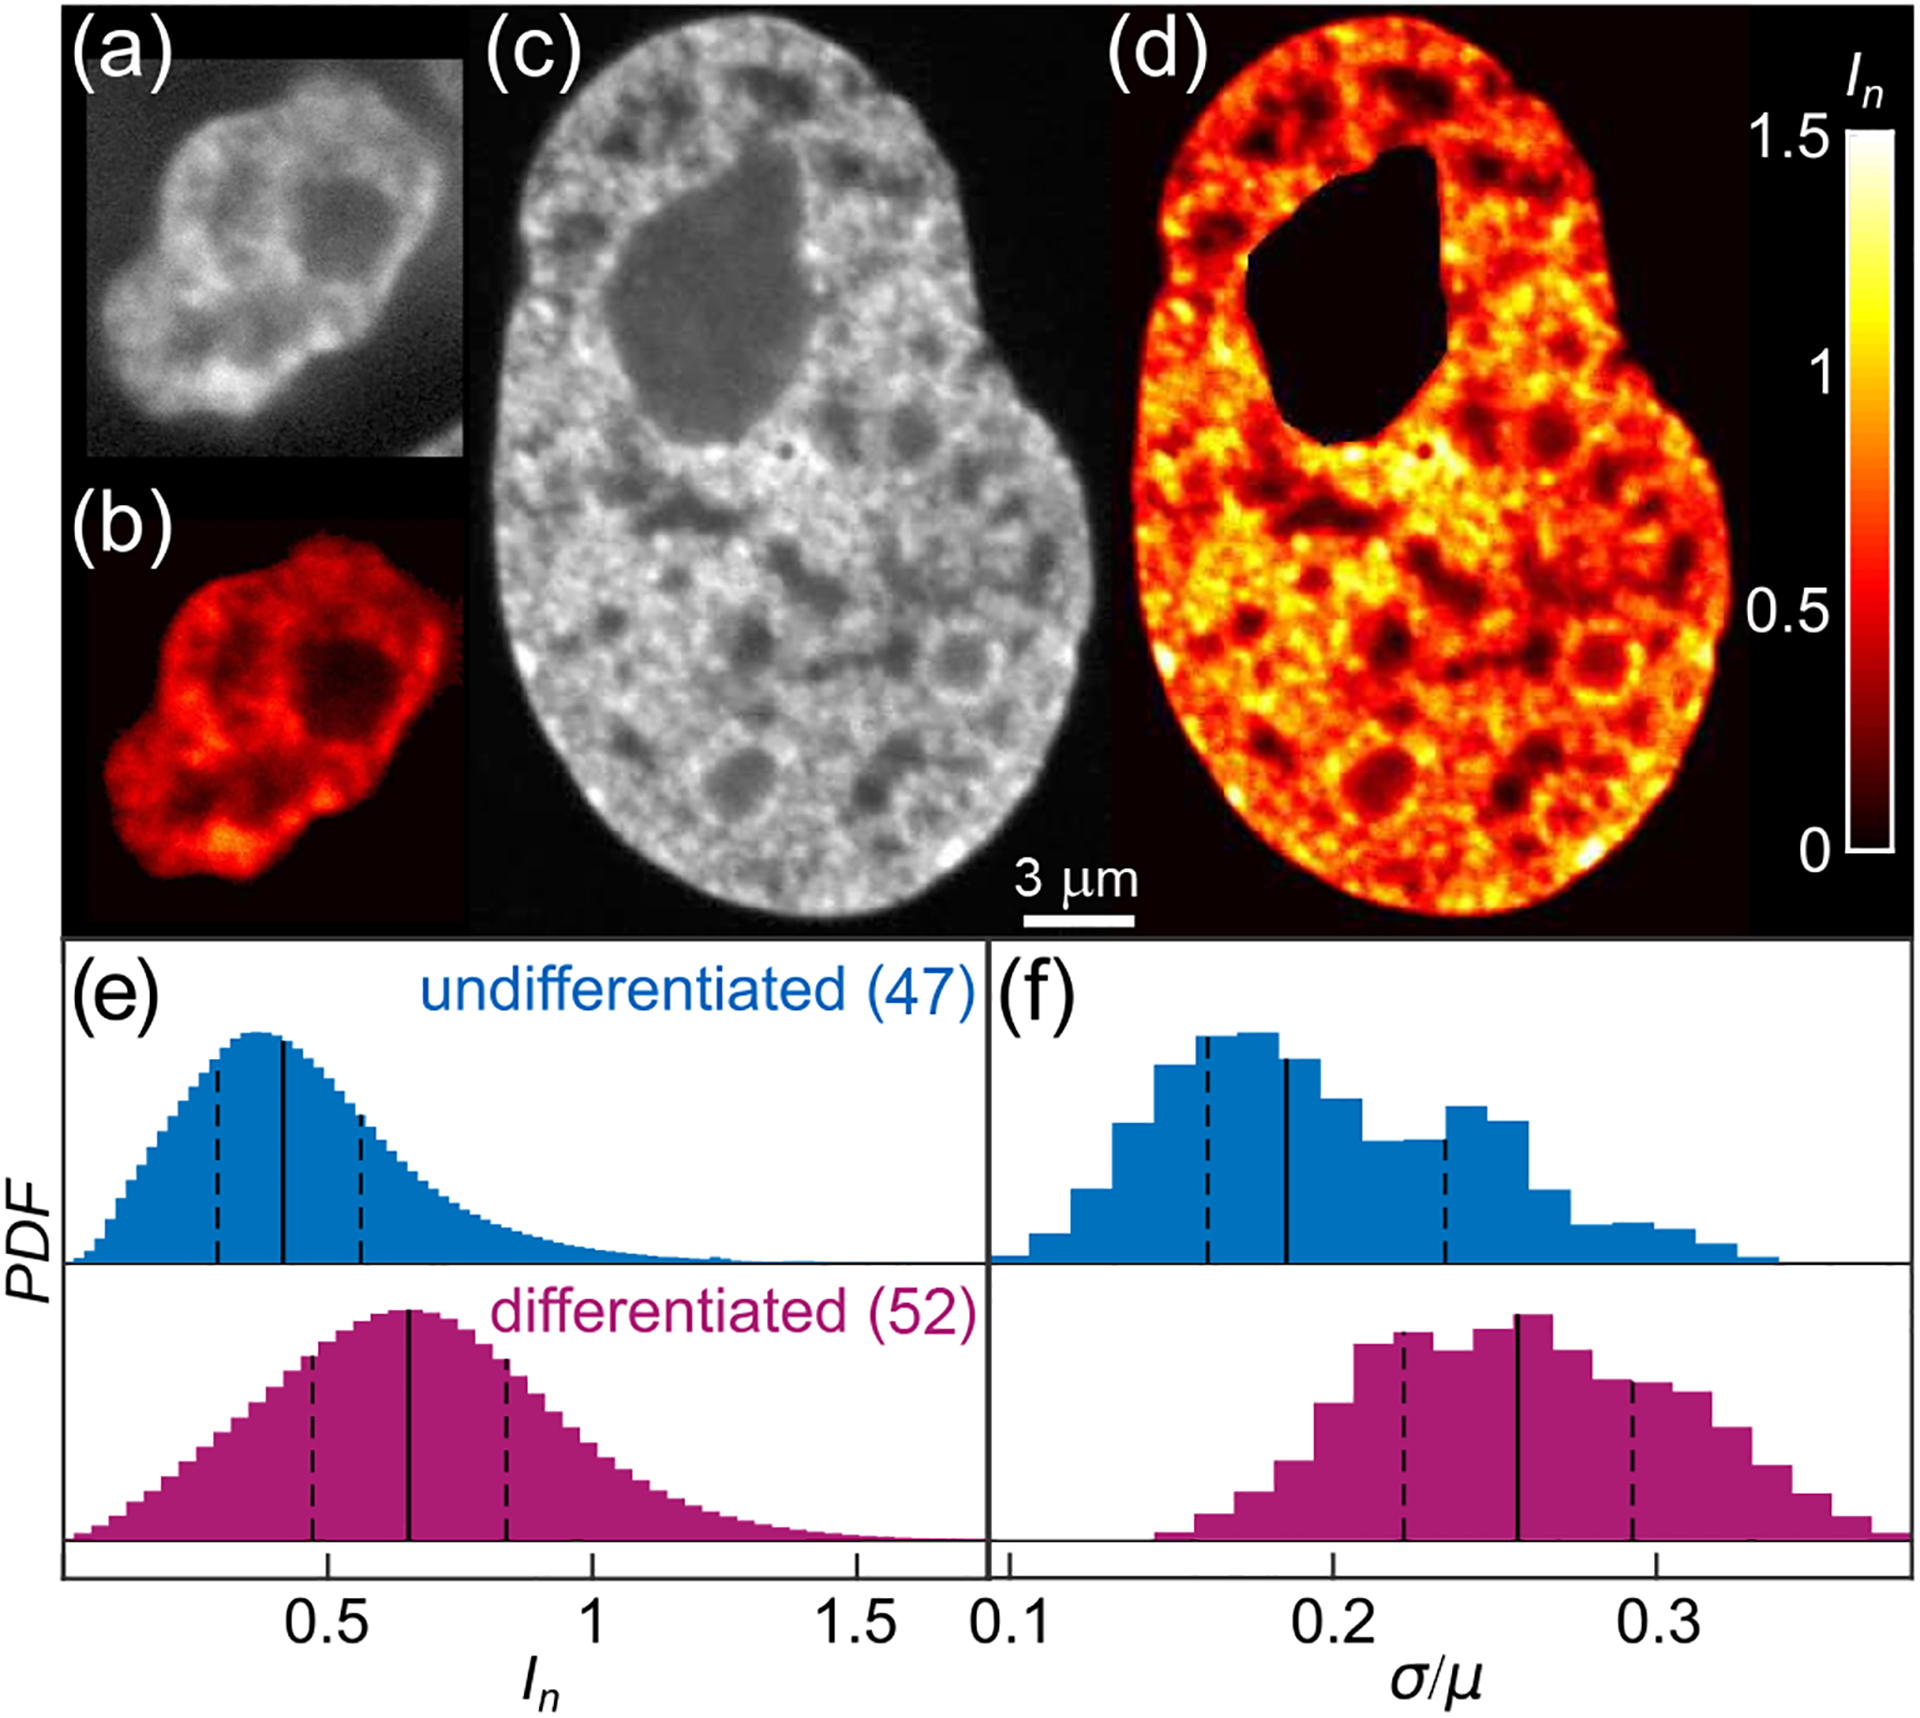
FIG. 1.

Chromatin distribution before and after cell differentiation. (a) & (c) Micrographs of (a) an undifferentiated (ESC) and (c) a differentiated nucleus with fluorescently labeled chromatin (H2B-GFP). (b) & (d) Color-coded normalized pixel intensities In (color bar, black to white) for (b) nucleus from (a), and (d) nucleus from (c). (e) Distribution of normalized pixel intensities In for 47 undifferentiated and 52 differentiated nuclei. (f) Distribution of σ/μ for population of undifferentiated (blue) and differentiated (magenta) nuclei. Solid and dashed lines correspond to the median and quartiles of the distribution, respectively.
