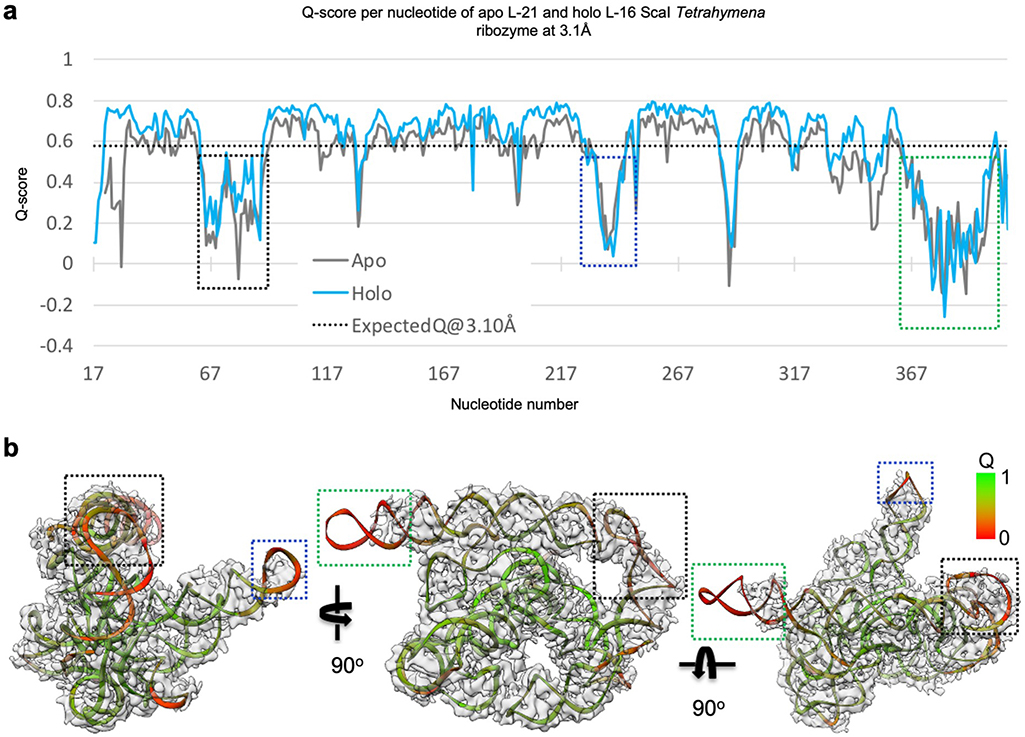
Extended Data Figure 3 related to Figure 1. Q-score analyses of cryo-EM maps and models of both the apo L-21 and holo L-16 Tetrahymena ribozymes.
(a) Q-score analyses per residue of the apo L-21 (grey) and holo L-16 (blue) Tetrahymena ribozyme cryo-EM models and maps, black dashed line indicates average Q score from nucleic acid cryo-EM models and maps at 3.1 Å resolution. (b) Colored cryo-EM model of apo L-21 ScaI ribozyme based on Q-score per residue. Dashed boxes (black, blue and green) correspond to different regions in the cryo-EM model with low Q-scores in panel (a).

