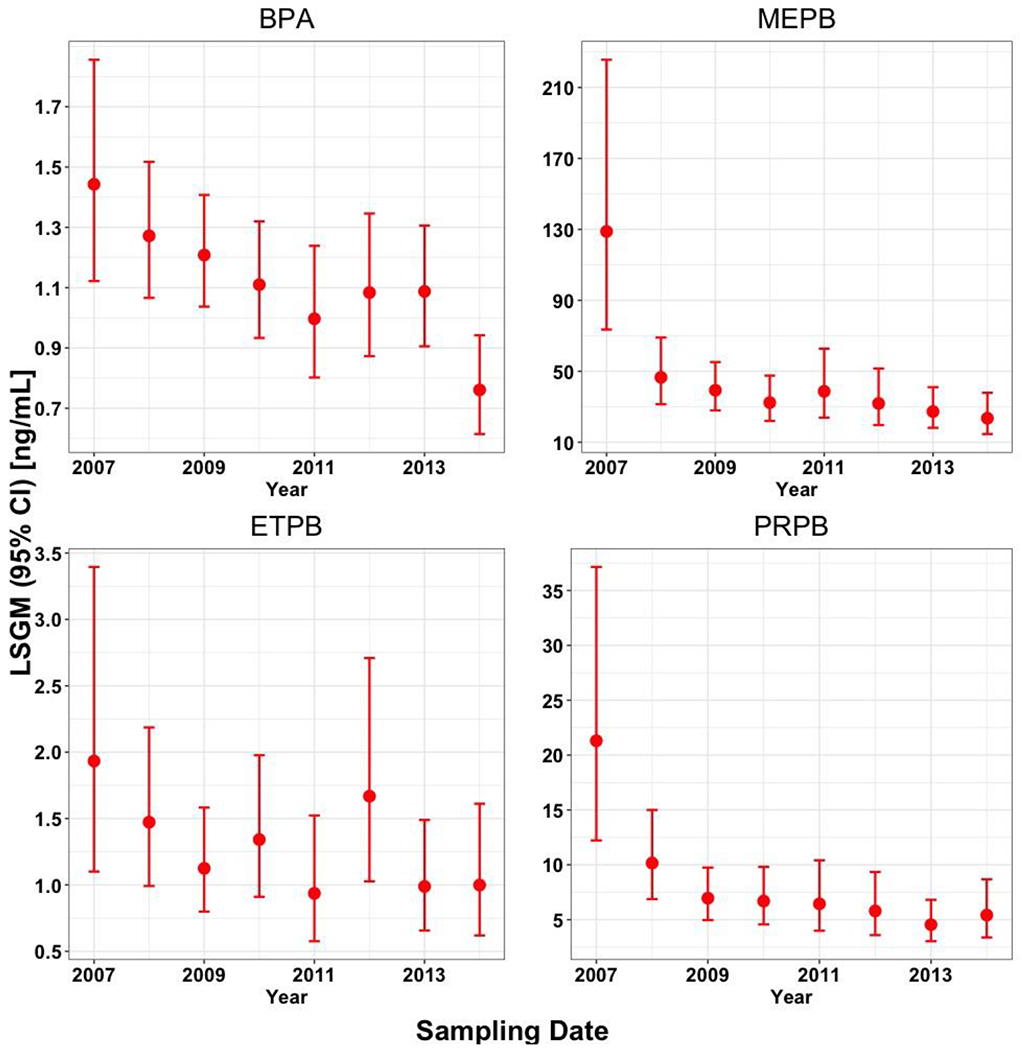
Figure 1.

Temporal trends in measured urinary concentrations (ng/mL) of bisphenol A (BPA), methyl paraben (MEPB), ethyl paraben (ETPB), and propyl paraben (PRPB) in 760 urine samples collected from California pregnant women in a high-familial risk ASD cohort during 2007–2014. The urinary concentrations were adjusted for SG, sampling year, race/ethnicity, pre-pregnancy body mass index (BMI), education, age at delivery, homeownership, and parity. Data points represent LSGMs (least square geometric means or adjusted geometric means) and error bars represent 95% confidence intervals (CIs).
