
Figure 4.
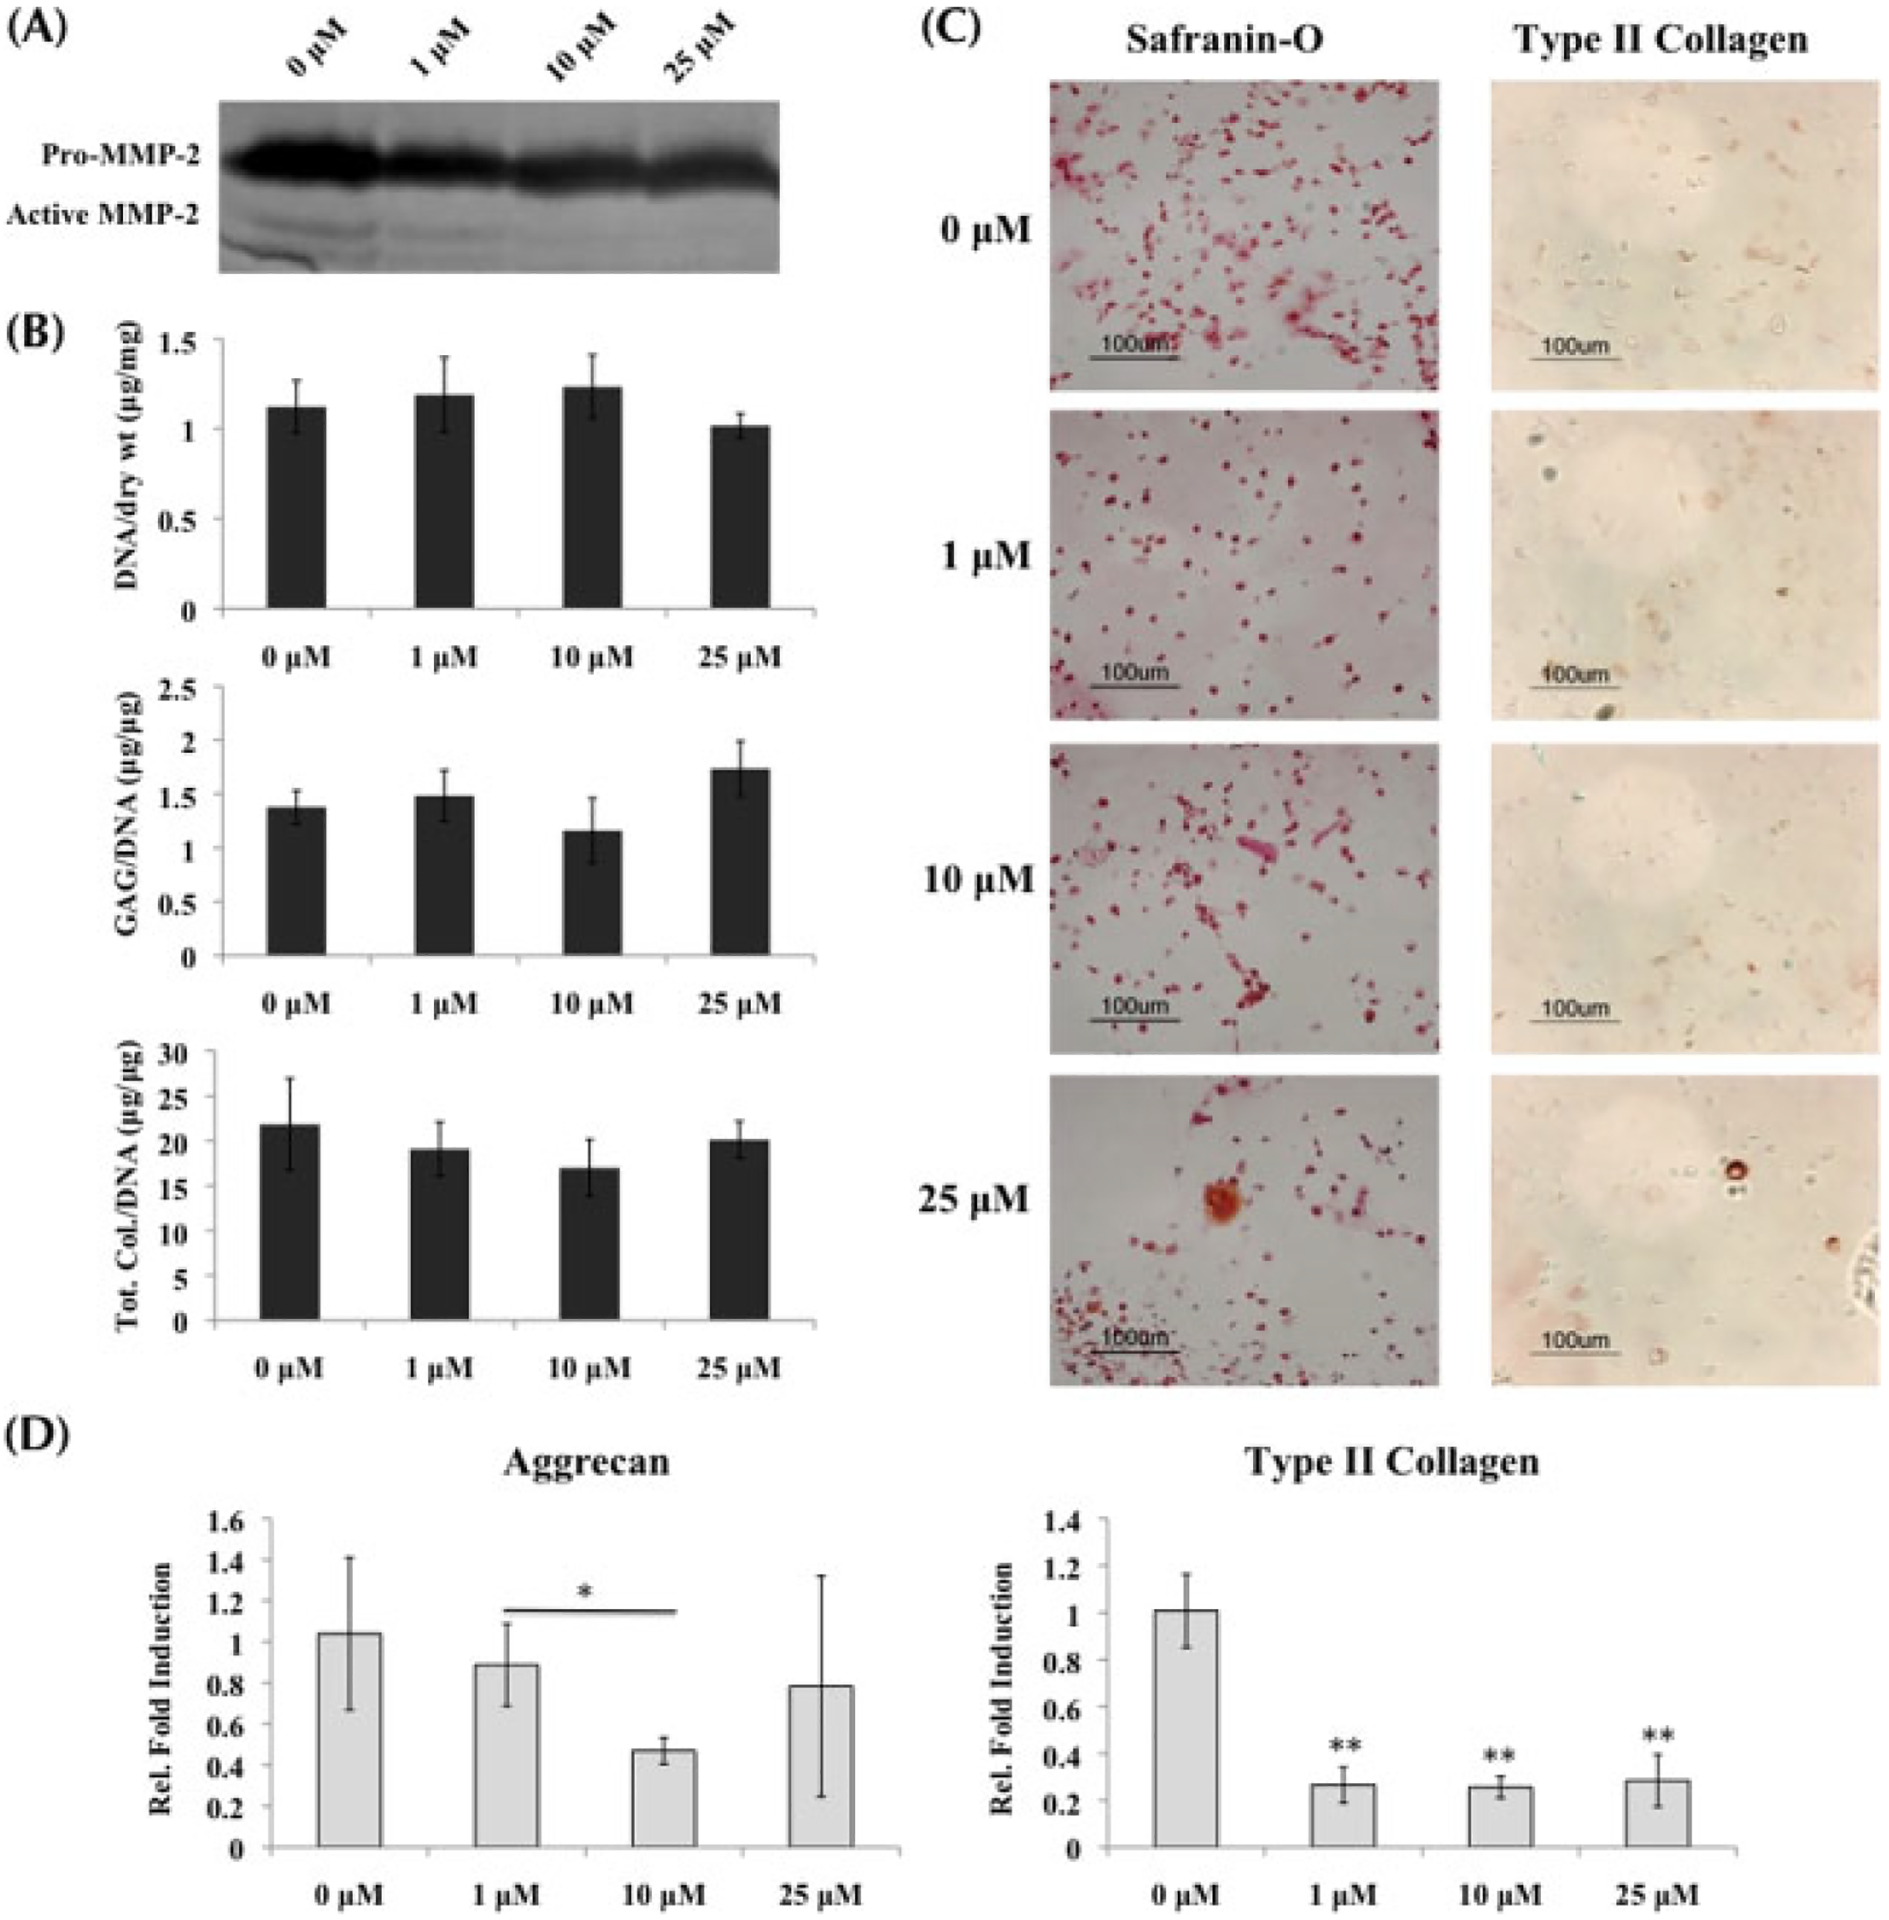
OA chondrocytes cultured in growth medium with MMP inhibitors; *statistical significance from control or 0 μM, unless otherwise specified. (A) Gelatin zymography verified the decreasing activity of MMP-2 in supernatant collected at day 21 as MMPi concentrations increased. (B) Biochemical analysis (n = 3) indicated no change from control in both GAG and total collagen content per DNA when MMPis were administered. (C) Histological staining for GAG and type II collagen supported the ECM results in (B). (D) Real-time PCR (n = 3) indicated that aggrecan transcription was downregulated in the presence of 10 μM of MMPis, while type II collagen transcription was decreased in the presence of all MMPi concentrations