Figure 6.
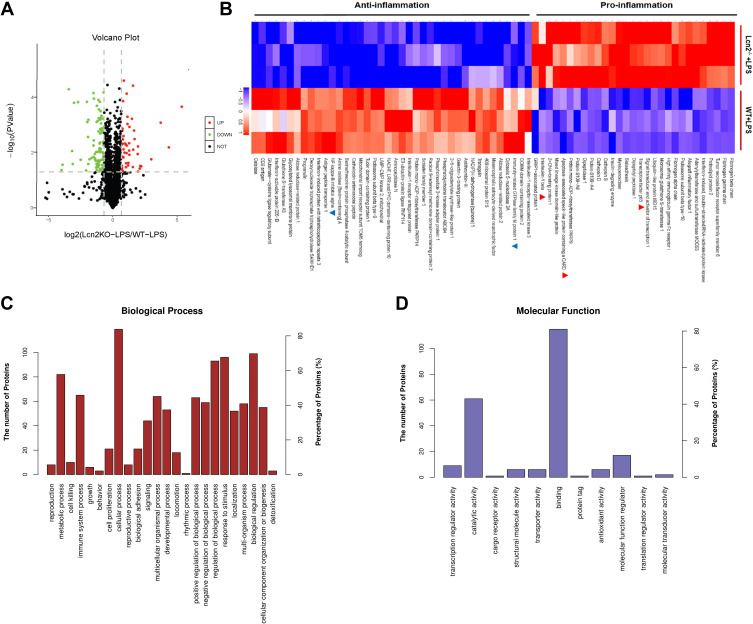
Proteomics analysis of LPS-treated BMDMs from Lcn2−/- and WT mice. (A) Volcano plots shows that 144 proteins changed significantly (a cutoff of absolutes fold change ≥ 1.6 or ≤ 0.625, and P < 0.05). Green dots represent down-regulated proteins, and red dots represent up-regulated proteins. (B) Series of inflammation-related proteins (n = 3). Blue color represents down-regulated proteins, and red color represents up-regulated proteins. (C) Biological processes of GO annotation. (D) Molecular function of GO annotation. Bar chart represents biological processes and molecular function enriched by altered proteins in response to Lcn2 deficiency.

