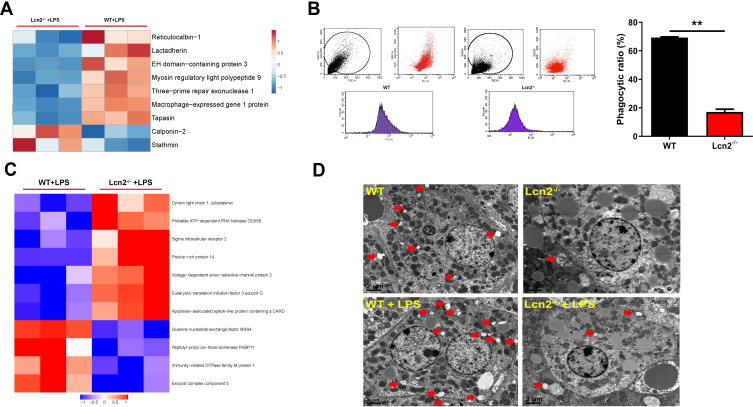
Figure 7.
Lcn2 deficiency inhibits the phagocytosis of BMDMs and hepatocyte autophagy. (A) Series of phagocytosis-related proteins (n = 3). Blue color represents down-regulated proteins, and red color represents up-regulated proteins. (B) Flow cytometry analysis of BMDMs incubated with FITC-dextran (n = 3). (C) Series of autophagy-related proteins (n = 3). Blue color represents down-regulated proteins, and red color represents up-regulated proteins. (D) Representative TEM images of autophagosomes (red arrows) in liver of mice at 24 hpi (n = 4). Values were average means of triplicate experiments. Results were expressed as means ± SEM. Statistical analysis used Mann–Whitney U-test. **P < 0.01.

