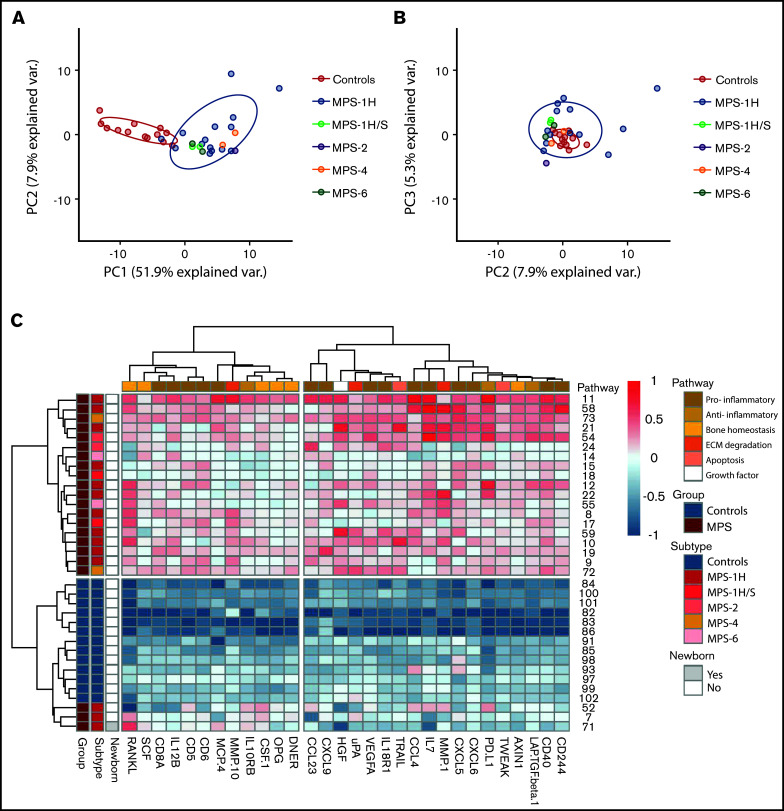
Figure 1.
PCA and heatmap of inflammation markers in untreated patients with MPS vs control subjects. (A) Principal component 1 (PC1) vs principal component 2 (PC2) shows clear separation of control subjects (blue) and patients with MPS (n = 22). (B) PC2 vs principal component 3 (PC3). (C) Heatmap of inflammation markers both present in PC1 of PCA and list of significant and >1.5-log2 fold change supervised analysis. On the left, color coding is shown for group (control subjects vs MPS), subtypes (of the different MPS), and whether the patient was a newborn. The color coding on top indicates to which pathway the different markers belong. ECM, extracellular matrix.

