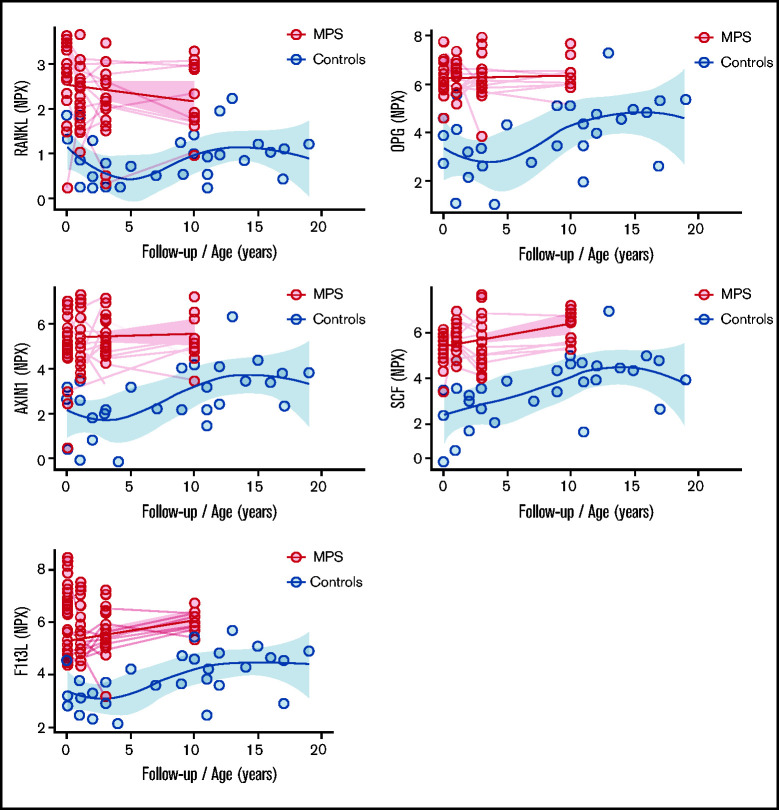
Figure 2.
Differentiating markers with log2 fold change >1.5 at 10 years’ follow-up. Longitudinal data of patients with MPS I are shown in red; cross-sectional data of control subjects are shown in blue. Average line is estimated by a linear mixed model for longitudinal patient data and shown with a “Loess” curve for control subjects. The shaded area reflects the 95% confidence intervals. X-axes show follow-up (in years) for patients and age (in years) for control subjects. Median age at transplantation was 1.3 years (range, 0.2-4.8 years).

