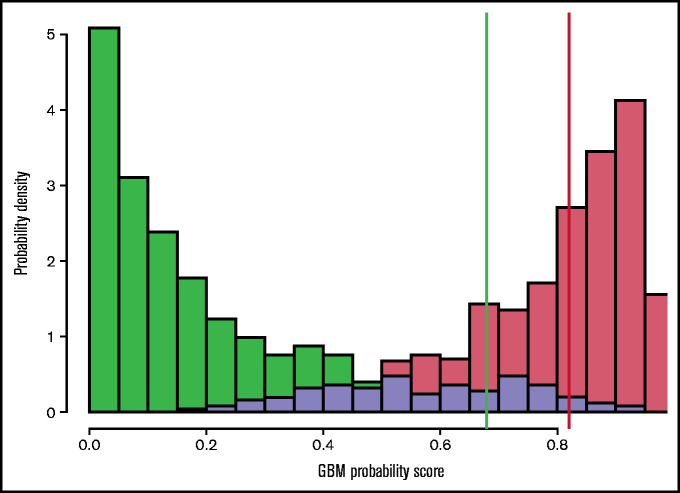
Figure 1.
GBM probability scores stratified by case (red) and control (green) status. The lavender region represents overlap between case and control patients. Threshold values of 0.68 (green vertical line) and 0.82 (red line) are indicated; above the red threshold value a patient is predicted to have MDS, below the green threshold, the patient is predicted not to have MDS. Between these 2 threshold values, no prediction is made. In this figure, case and control prevalence is assumed equal to illustrate the score distributions most clearly; in practice, case prevalence is likely to be much lower (we have taken 20% as indicative in our calculations).

