Figure 3.
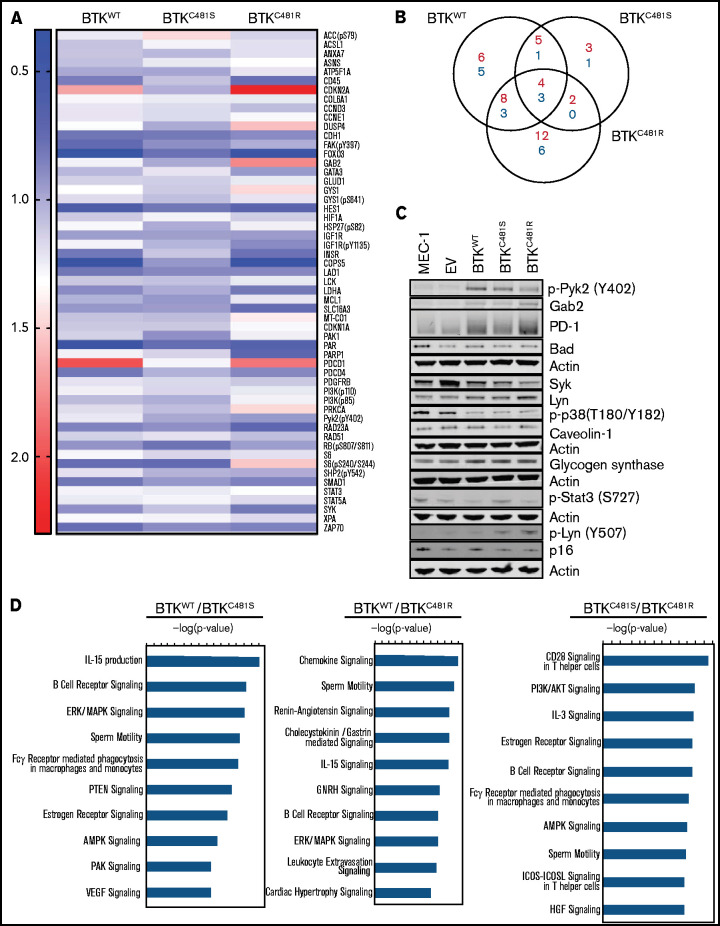
Functional protein profiling of WT and mutant-BTK–overexpressing MEC-1 cells. Protein was extracted in biological triplicates from exponentially growing MEC-1 cells with either WT or mutant BTK and subjected to RPPA assays that included 426 antibodies. (A) Representative heat map of proteins with increased and decreased expression in each cell line (n = 3 per cell line). All BTK-overexpressing cell lines (BTKWT, BTKC481S, and BTKC481R) were compared with the BTKEV cell line. The fold changes of mean linear values were used to generate the heat map (fold change, ≥1.2 or ≤0.8). The color key indicates the fold change. (B) The number of increased (red) and decreased (blue) phosphorylated and total proteins in each transduced cell line compared with the cell line with the empty vector. (C) Validation of RPPA data for some proteins by immunoblot analysis. Protein extracts were subjected to immunoblot assays. To cover all of these proteins, 5 separate immunoblots were prepared, with actin used as the loading control for each. (D) The top 10 canonical pathways identified with Ingenuity Pathway Analysis and associated with the indicated BTKs.

