Figure 2.
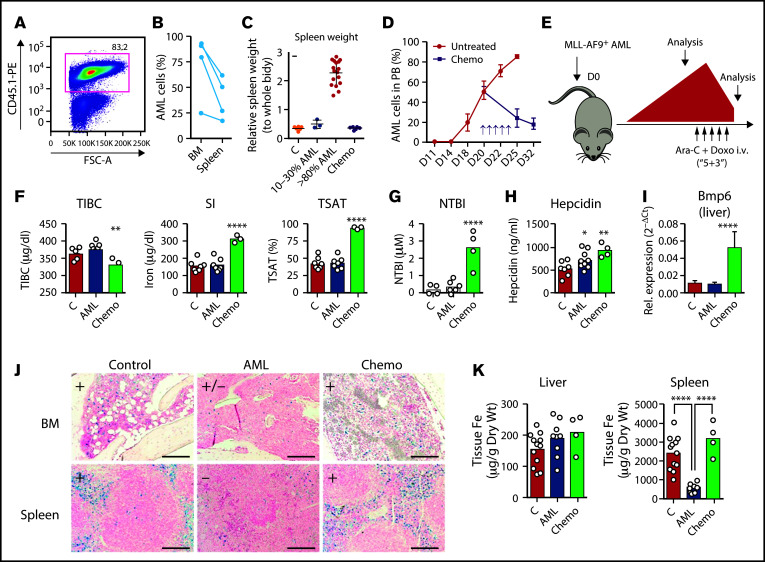
Iron metabolism in the MLL-AF9 AML mouse model. (A) MLL-AF9+ AML cells express a fluorescent protein or a specific marker, such as CD45.1 that allows the easy identification of AML cells by flow cytometry. (B) Mice transplanted with MLL-AF9+ AML cells are primarily infiltrated by leukemic blasts in the BM and in the spleen (n = 3 mice). (C) The progressive infiltration of the spleen leads to increase weight that normalizes upon chemotherapy treatment. The y-axis denotes percentage (n = 12) (C, control), 3 (10%-30% AML), 17 (>80% AML), and 10 (postchemotherapy [chemo]) mice. (D) Disease progression and response to chemotherapy (arrows; purple line) can be monitored by flow cytometry of the peripheral blood (PB). n = 5-20 mice per time point. (E) Nonirradiated mice recipients were transplanted with 100 000 MLL-AF9+ AML cells and analyzed at full infiltration and after induction chemotherapy with cytarabine (Ara-C) and doxorubicin (Doxo). (F) Mice burden with AML had similar TIBC, SI, TSAT, and NTBI levels. After chemotherapy, mice had increased SI levels, elevated TSAT, and (G) presence of toxic NTBI. Each dot represents a mouse. (H) Circulating hepcidin levels were significantly increased in AML and after chemotherapy. (I) Hepatic Bmp6 expression was significantly increased after chemotherapy treatment, as assessed by qPCR. n = 4-6 mice per group. (J) Representative images of Perls’ staining of BM and spleen sections from control, AML-burdened, and chemotherapy-treated leukemic mice. Scale bar = 200 µm. (K) Quantification of nonheme iron levels in the liver and spleen. Each dot represents a mouse.

