
Fig. 2:
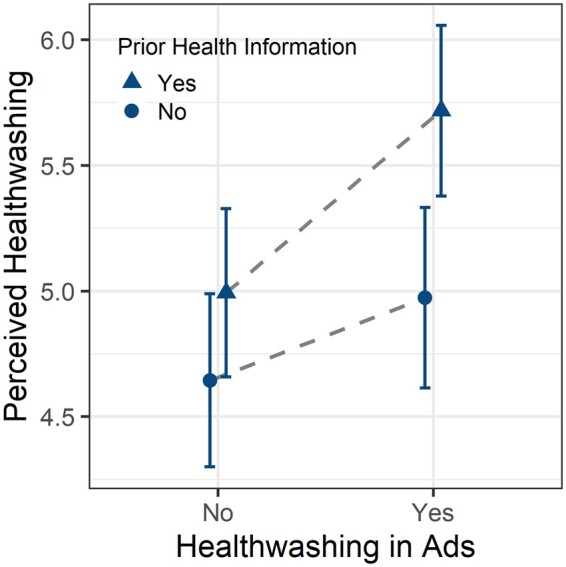
Mean values of perceived healthwashing across experimental groups (error bars indicate 95% CI). The graph is based on Model 1 in Table 1.
Official websites use .gov
A
.gov website belongs to an official
government organization in the United States.
Secure .gov websites use HTTPS
A lock (
) or https:// means you've safely
connected to the .gov website. Share sensitive
information only on official, secure websites.
Mean values of perceived healthwashing across experimental groups (error bars indicate 95% CI). The graph is based on Model 1 in Table 1.