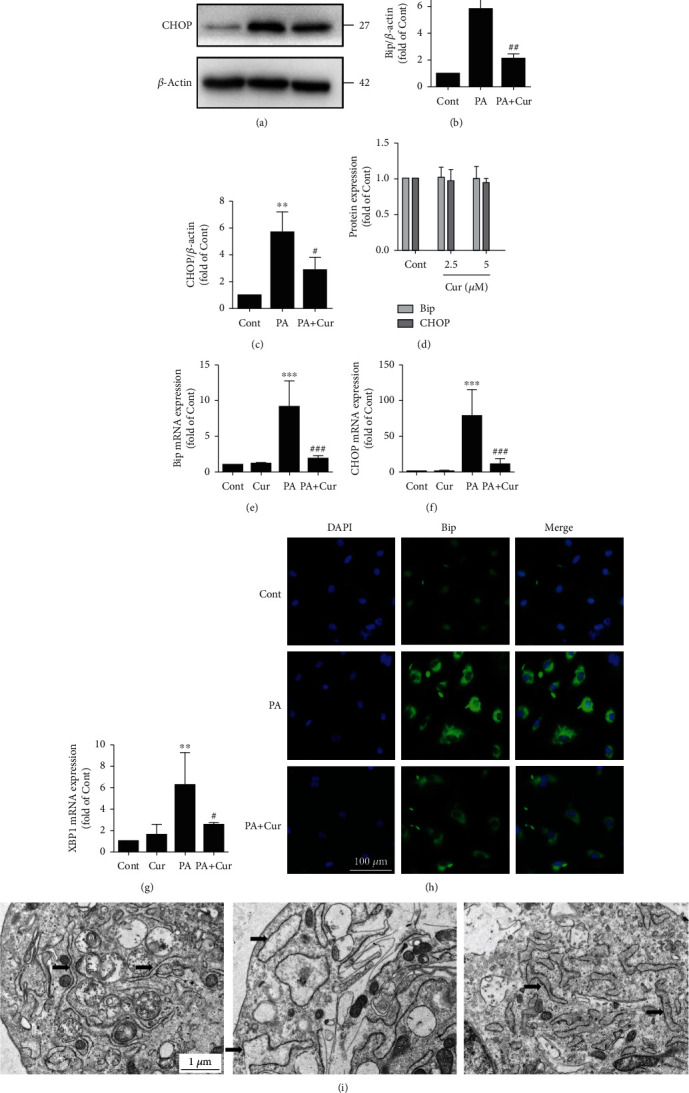
Figure 6.

Curcumin ameliorates ER stress in HUVECs. (a) The protein expression levels of Bip and CHOP were measured by Western blotting. The expression of Bip (b) and CHOP (c) was quantified via densitometry using ImageJ software (n = 3; 1-way ANOVA with Duncan's posthoc test). (d) The expression of Bip and CHOP (Figure 5(c)) was quantified via densitometry using ImageJ software (n = 3; 1-way ANOVA with Duncan's posthoc test). (e–g) The mRNA expression levels of ER stress-related genes (Bip, CHOP and XBP1s) were measured by quantitative PCR (n = 4; 1-way ANOVA with Duncan's posthoc test). (h) Images of immunofluorescence staining of Bip in HUVECs in different groups. (i) Cellular ultrastructure in different groups. The arrows indicate endoplasmic reticulum. The data are shown as means ± SD (∗∗∗P < 0.001, ∗∗P < 0.01 vs. the Cont group;###P < 0.001, ##P < 0.01, #P < 0.05 vs. the PA group).
