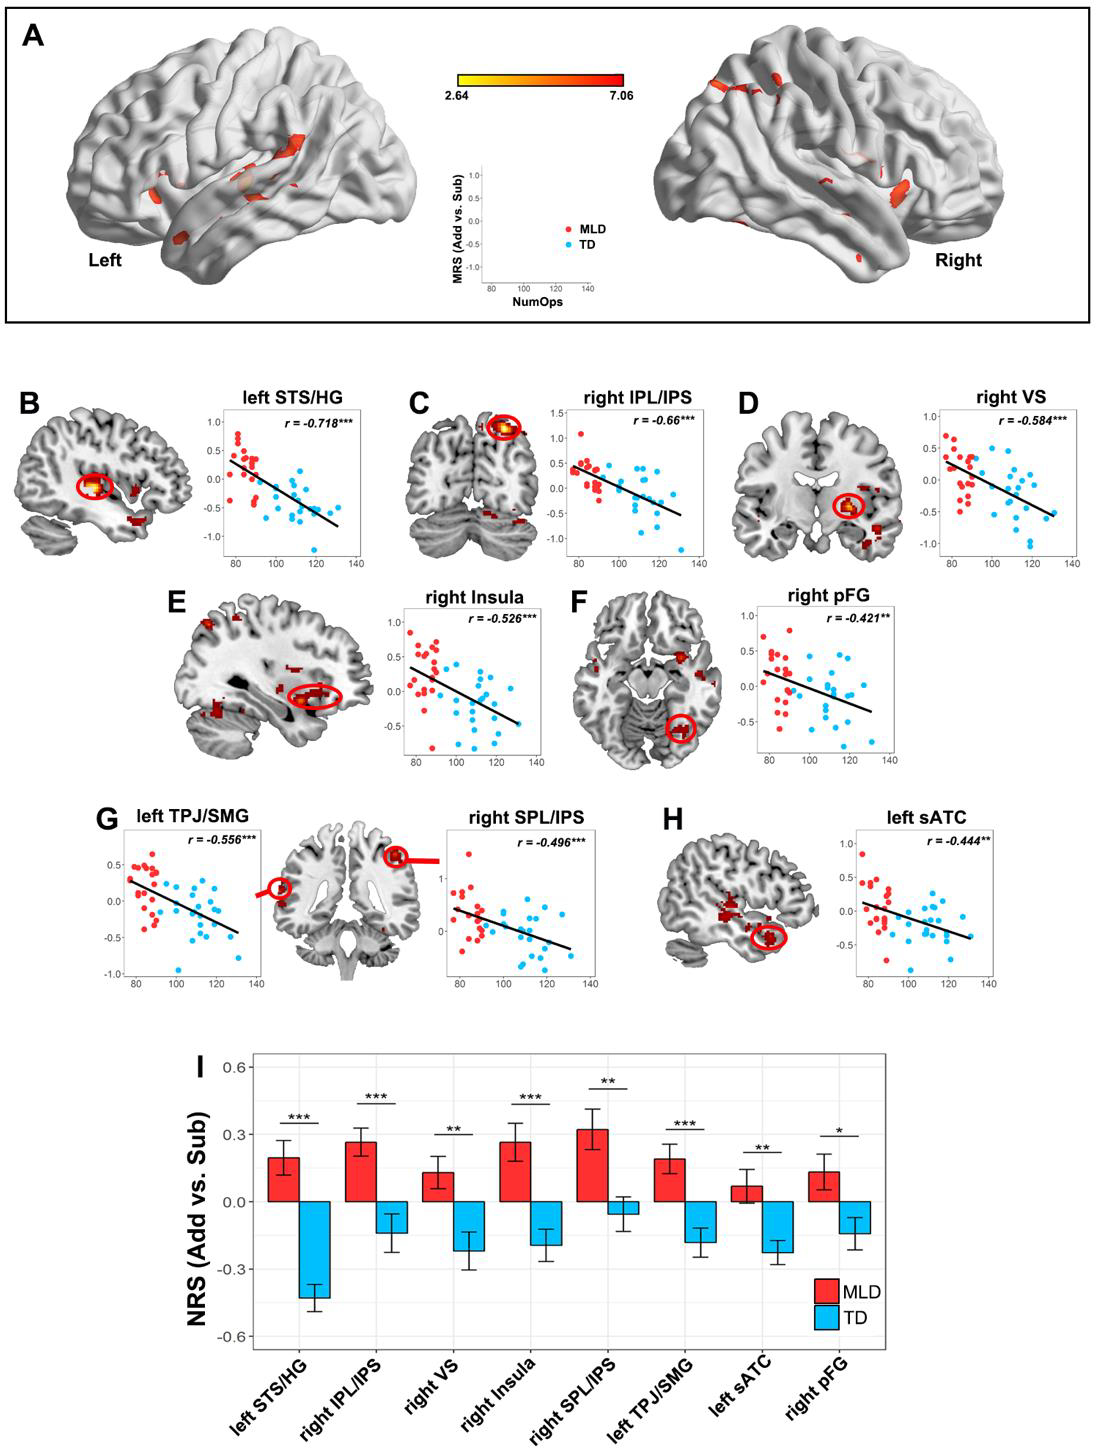
Figure 3. Higher Neural Representational Similarity (NRS) in children with low math abilities.

(A) Brain regions showing significant negative correlation between NRS and Numerical Operations (NumOps) subscores of the WIAT-II. (B-H) Children with low math abilities show higher NRS in multiple parietal, temporal and prefrontal cortical regions (I) Children with MLD show higher NRS than TD children (ROIs were chosen to visualize the MRS difference in a categorical approach). Note: Statistical testing and analysis were conducted using a stringent threshold (height, p < 0.005; FDR-corrected for cluster extent p < 0.01); to facilitate visualization activation maps are shown at p < 0.01 (height) (FDR-corrected for cluster extent p < 0.01). STS/HG = Superior Temporal Sulcus and Heschl’s gyrus; IPS = Intraparietal Sulcus; VS = Ventral Striatum (putamen/pallidum); pFG= posterior Fusiform Gyrus; TPJ/SMG = Temporoparietal Junction and Supramarginal Gyrus; SPL/IPS = Superior Parietal Lobule and Intraparietal Sulcus; and sATC = superior Anterior Temporal Cortex.
