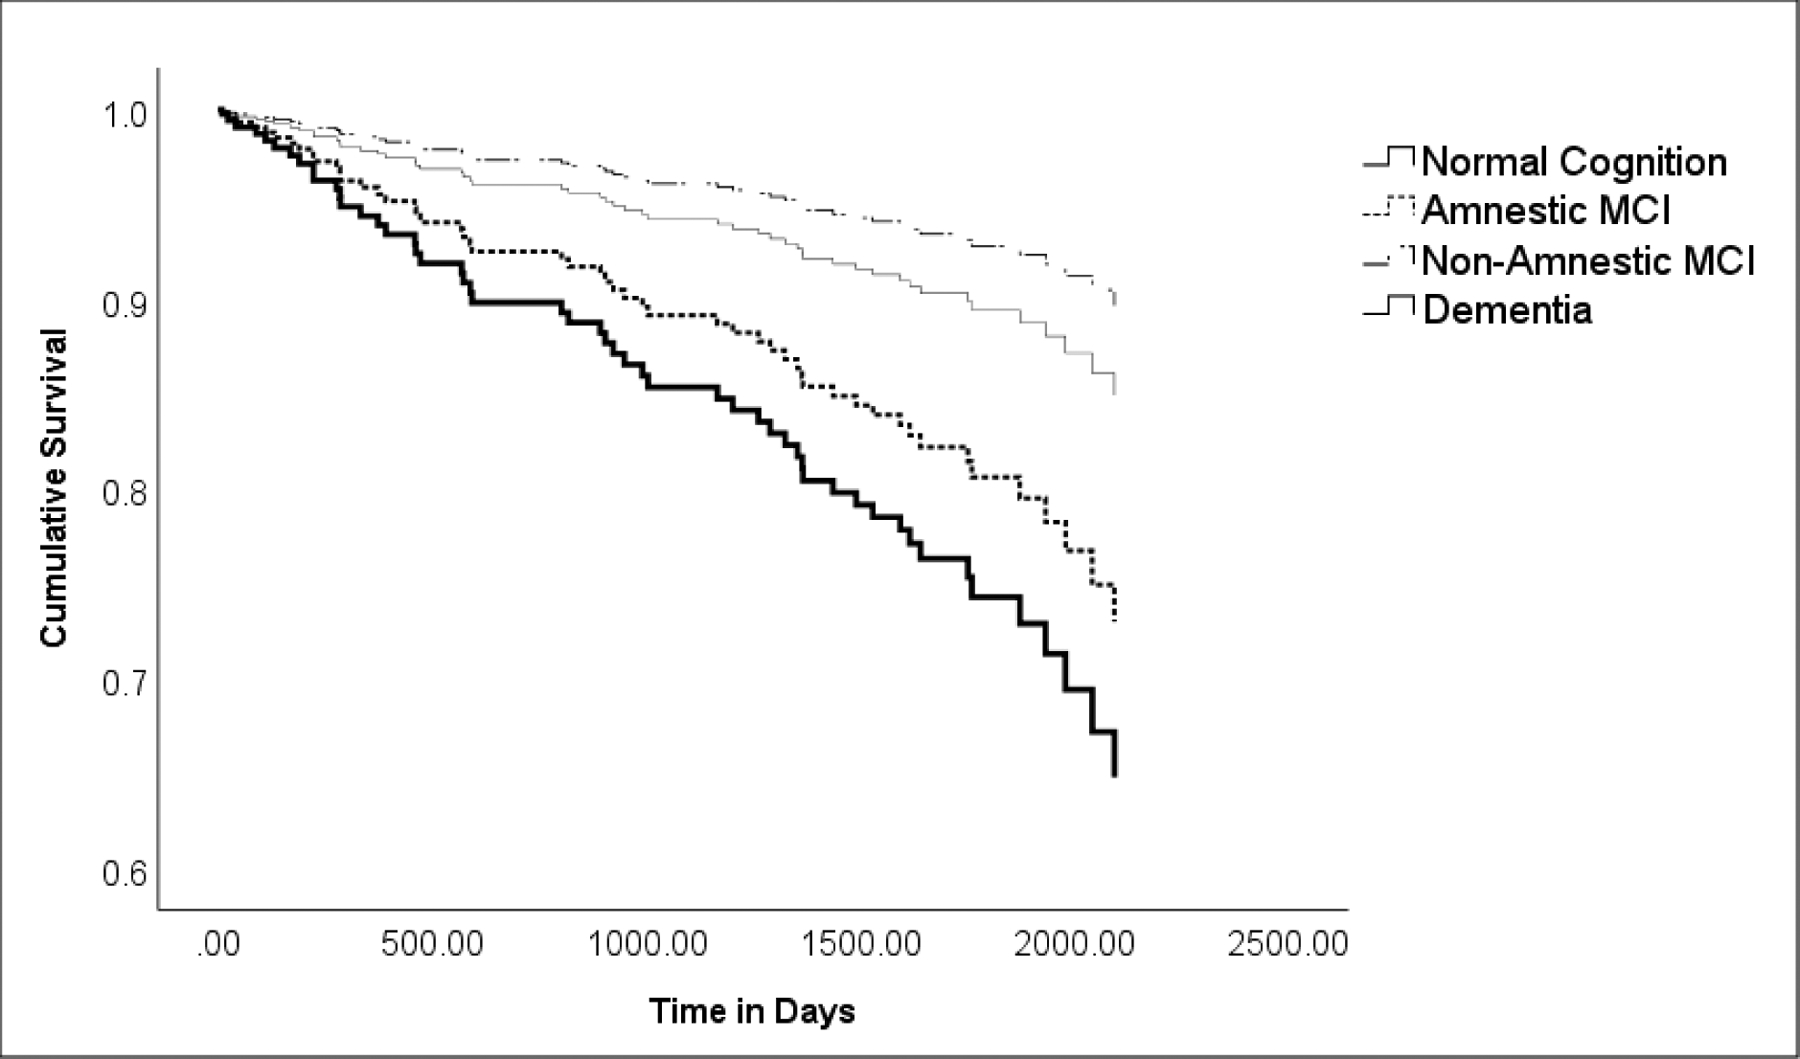
Figure 1. Survival Curve by Clinical Diagnosis Category.

ET cases were stratified into four cognitive diagnoses: normal cognition, amnestic MCI, non-amnestic MCI, and dementia. Hazards ratio (95% Confidence Interval) in Cox proportional hazards model for non-amnestic MCI = 0.67 (0.16 – 2.83); amnestic MCI = 1.93 (0.93 – 3.98,) p = 0.08; dementia = 2.66 (1.32 – 5.34), p = 0.006. While the curves for normal cognition and amnestic MCI diverge, the difference was not significant (p = 0.58).
