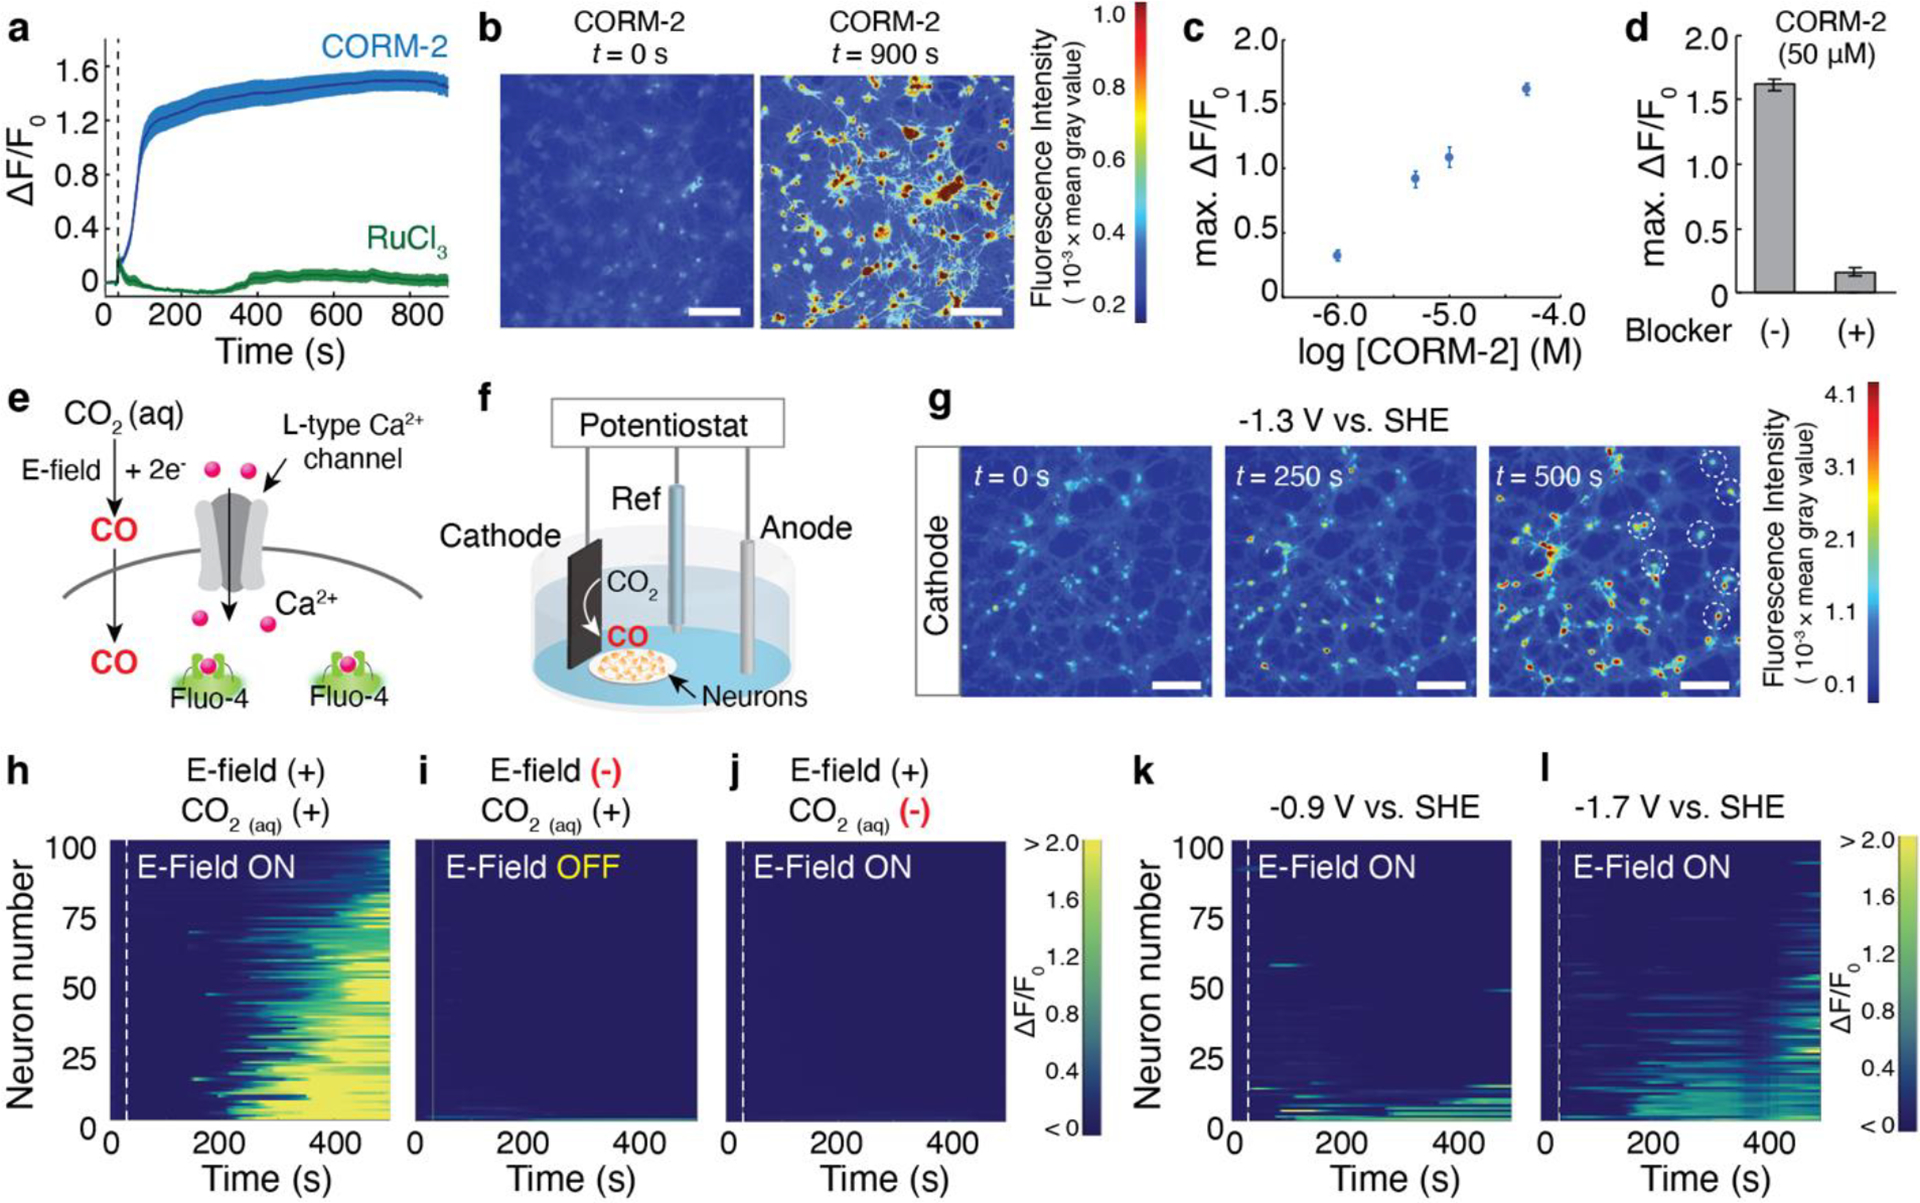
Figure 3.

a, Averaged fluo-4 fluorescence traces for hippocampal neurons (n = 100 neurons for each trace) following 50 μM CORM-2 (blue) or 50 μM RuCl3 (green) infusion at 30 s (dashed lines). The solid lines and shaded areas represent the mean and s.e.m., respectively. b, Time-lapse images of Ca2+ responses in response to CORM-2 infusion (scale bar, 50 μm). c, CORM-2 concentration-dependent maximum of normalized fluo-4 fluorescence change averaged across 100 neurons. d, Maximum of normalized fluo-4 fluorescence increases in 100 neurons following the infusion of 50 μM CORM-2 in the presence or absence of L-type Ca2+ channel blocker nitrendipine. e, A schematic illustrating a potential mechanism of CO-mediated Ca2+ responses in neurons through L-type Ca2+ channel. f, Experimental scheme for electrochemical CO delivery to neurons. g, Time-lapse images of Ca2+ increases in neurons triggered by CO produced from CoPc/OxCP cathodes, which were positioned at the left edge in all three images, at −1.3 V versus SHE (scale bar, 50 μm). Neurons located at greater distances from the cathode responded over time (white dotted circles). h-j, Individual fluo-4 fluorescence traces for 100 neurons at different experimental conditions. E-field (–) in (i) represents neurons immersed in CO2-saturated solution in the absence of an applied voltage. CO2(aq) (–) in (j) represents neurons immersed in Tyrode’s not saturated in CO2 in the presence of an applied voltage (j). Voltage of −1.3 V were turned on at 30 s (dashed lines) in h and j. k-l, Individual fluo-4 fluorescence traces for 100 neurons after electrochemical CO generation at −0.9 V (k) and −1.7 V versus SHE (l). Voltages were turned on at 30 s (dashed lines).
