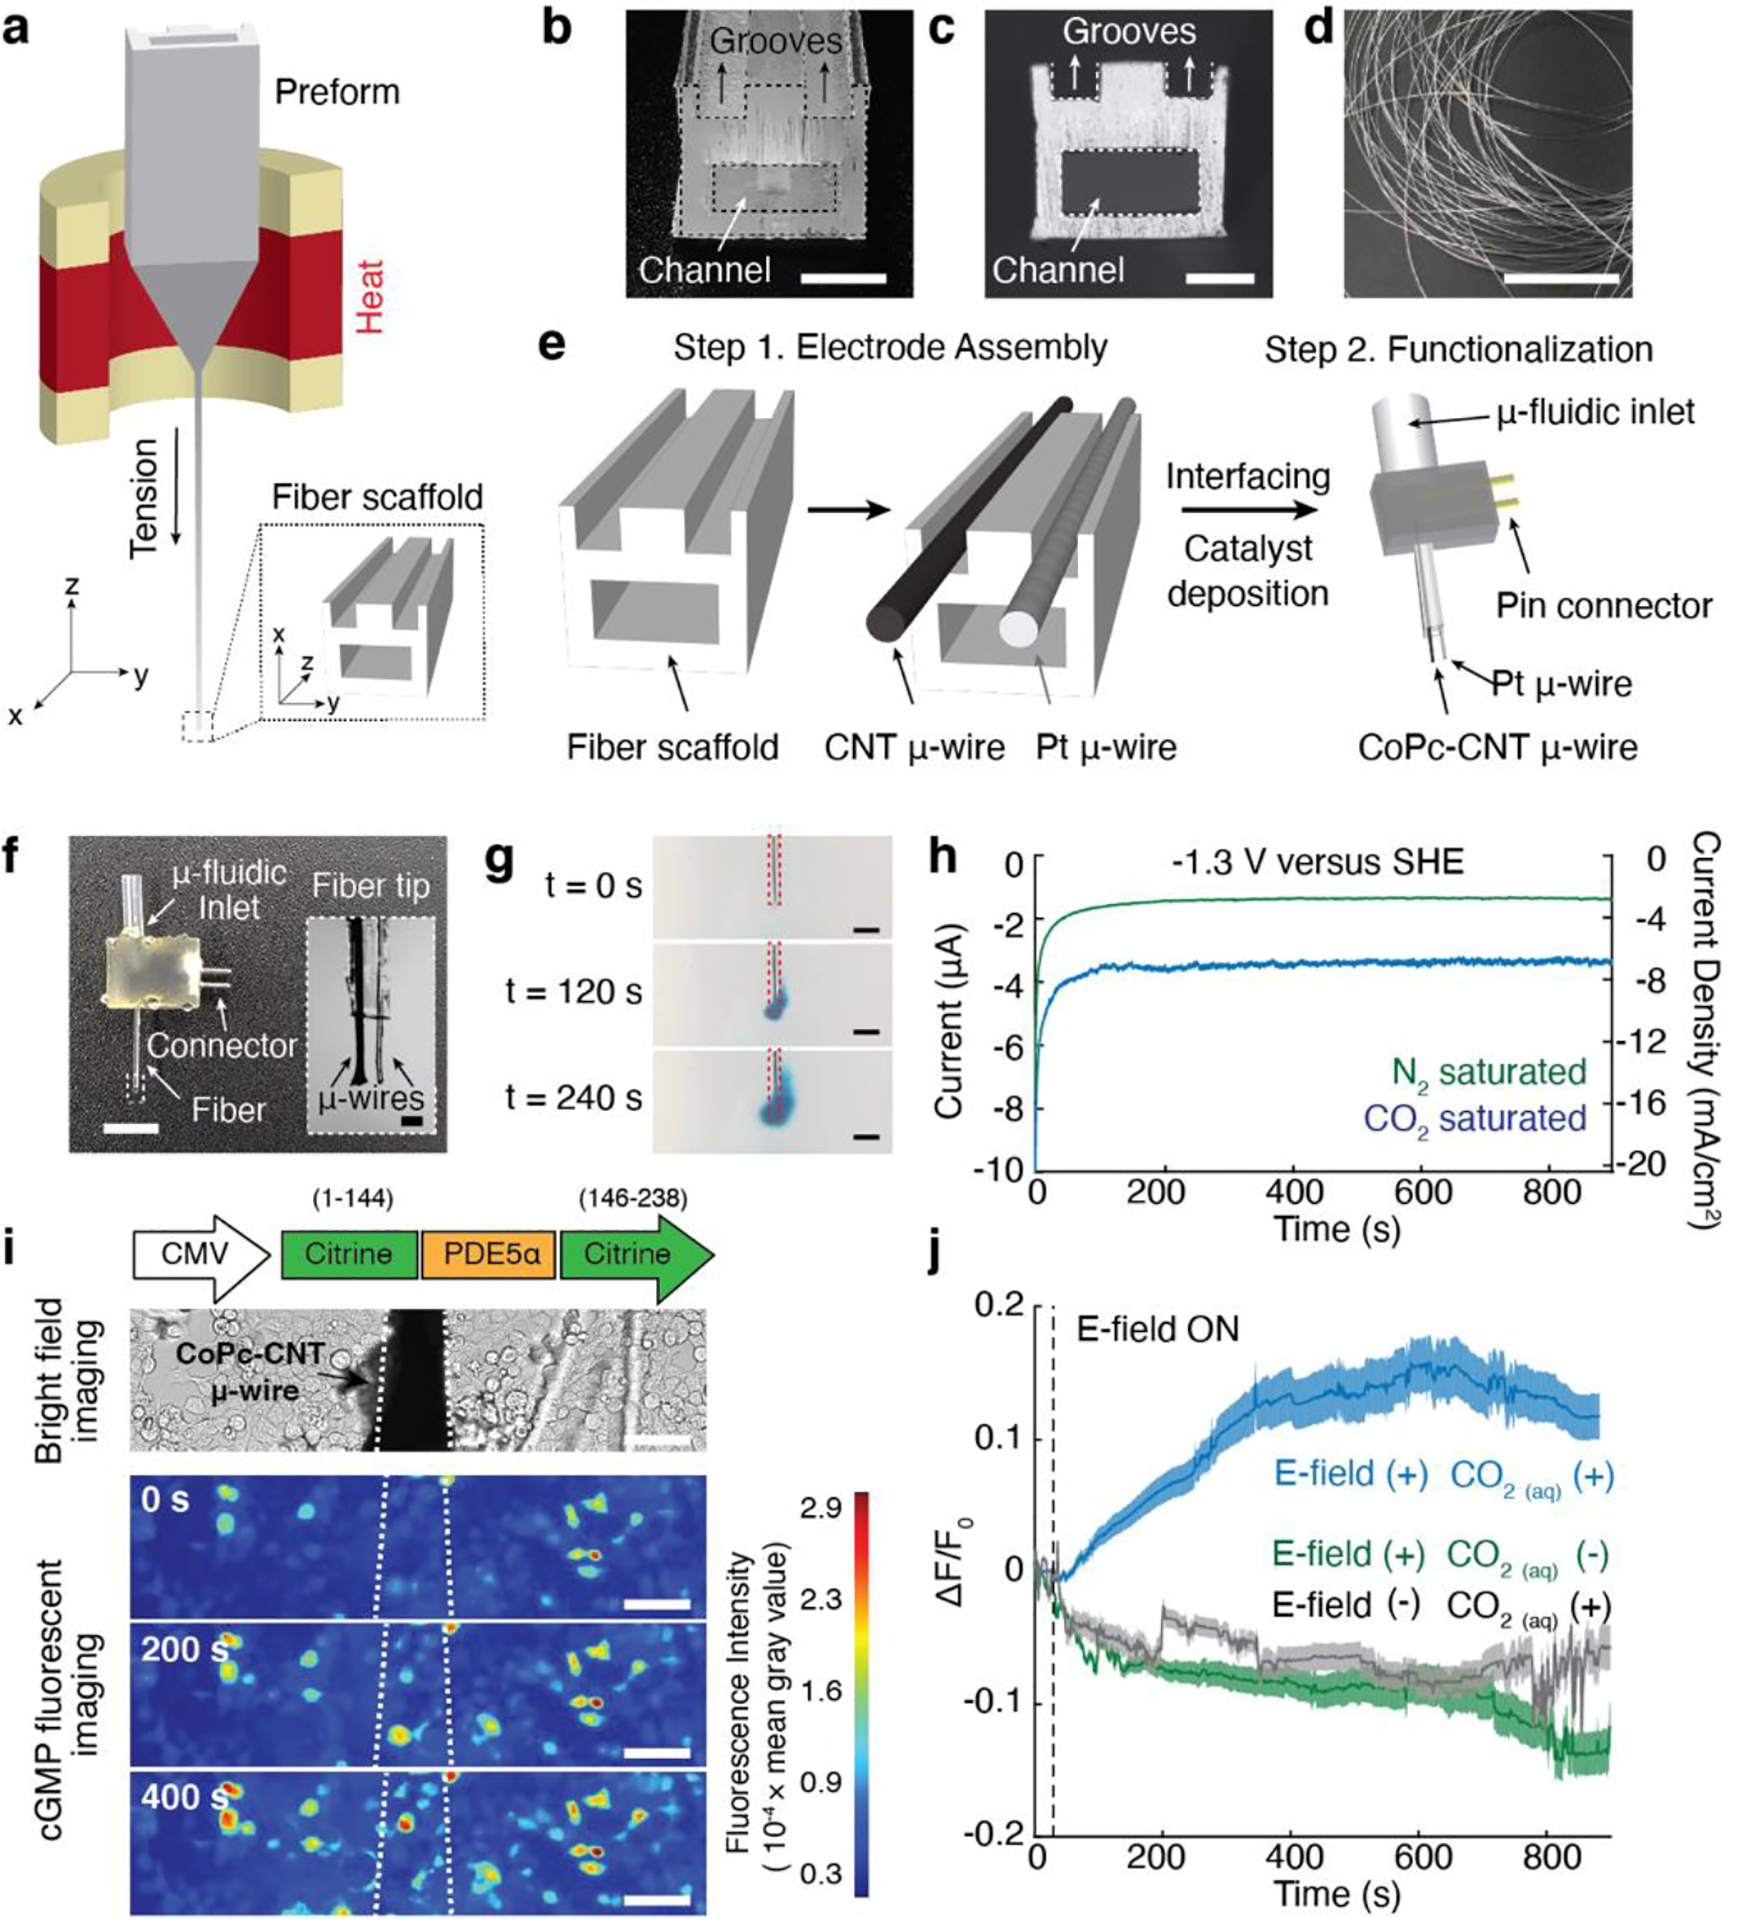
Figure 4.

a, A schematic illustrating the fiber drawing procedure. b-c, Cross-sectional images of the preform (b, scale bar, 5 mm) and the fiber scaffold after the drawing process (c, scale bar, 100 μm). Two microscale grooves and one hollow microchannel are visible in c. d, A photograph of a bundle of fiber scaffolds after the drawing process (scale bar, 5 cm). e, A schematic demonstrating microelectrode assembly on the fiber scaffold, followed by fiber connectorization and functionalization of the CNT microwires with CoPc catalyst. f, A photograph of the resulting CO delivery fiber (scale bar, 5 mm) and a microscope image of the fiber tip (inset, scale bar, 100 μm). g, Delivery of CO2-saturated Tyrode’s solution with a dye (BlueJuice) into a brain phantom (0.6% agarose gel) through the microfludic channel within the fiber at an infusion rate of 100 nL/min (scale bar, 500 μm). h, Chronoamperometry measurements conducted with the electrocatalytic fiber in CO2-saturated (blue) or N2-saturated (green) Tyrode’s solution at pH 7.4. i, An optical image of a CoPc-CNT microwire of the CO-delivery fiber positioned above Green cGull-expressing cells (top). Time-lapse images of local cGMP dynamics in Green cGull-expressing cells in response to electrochemically synthesized CO from the CoPc-CNT microwire (white dotted lines) at −1.3 V versus SHE (scale bar, 50 μm) (bottom). j, Averaged Green cGull fluorescence traces of cells (n = 100 cells for each trace) at different experimental conditions. The solid lines and shaded areas indicate the mean and s.e.m., respectively. E-field (–) and CO2(aq) (–) indicate cells after delivery of CO2-saturated solution in the absence of an applied voltage and cells subjected to cathodic voltage without CO2 saturation, respectively. Voltages of −1.3 V were turned on at 30 s (dashed lines).
