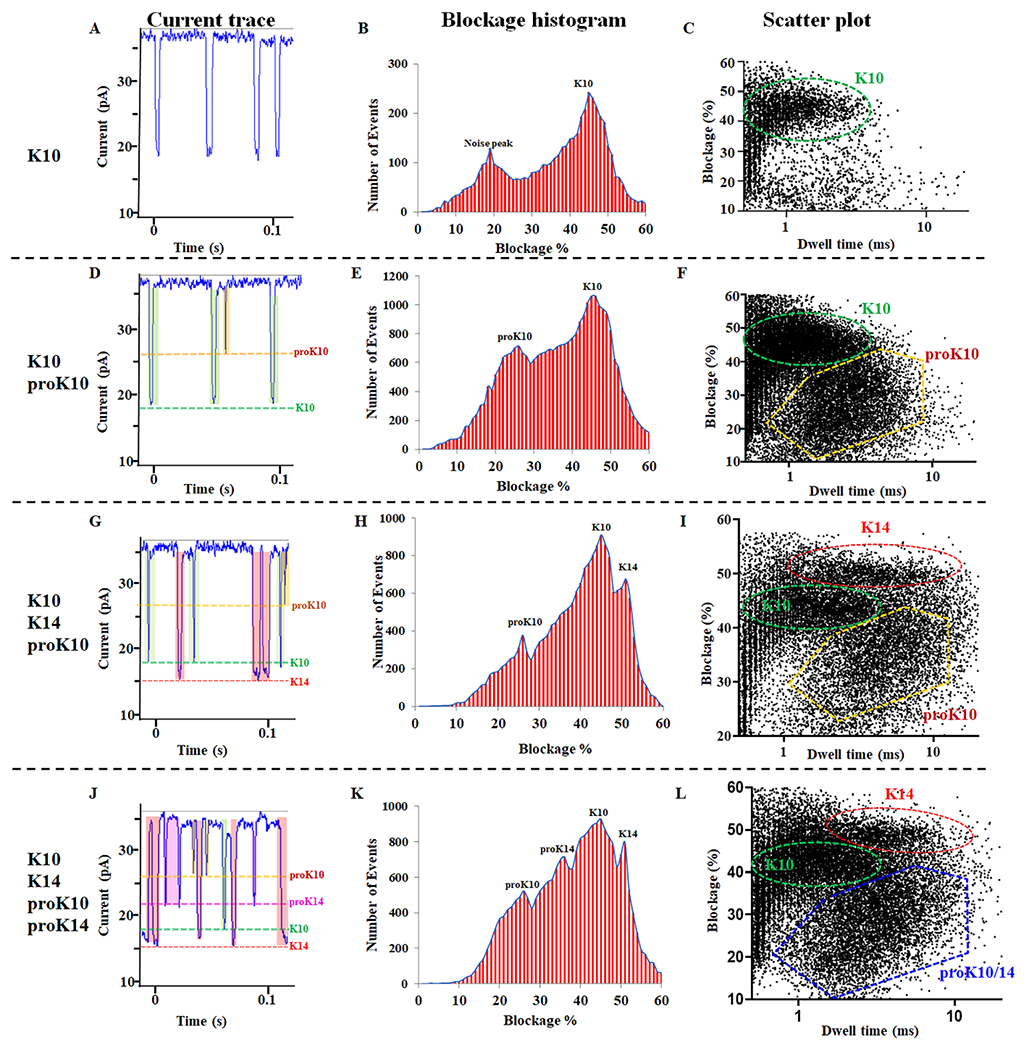
Figure 4. C-Δ25 GP10 to differentiate K10, proK10, K14, and proK14.

(A, D, G and J) The current trace showing the appearance of translocation signals after the addition of K10, K10/proK10, K10/proK10/K14, and K10/proK10/K14/proK14. (B, E, H, and K) The current blockage resulted from the addition of K10, K10/proK10, K10/proK10/K14, and K10/proK10/K14/proK14. (C, F, I and L) The scatter plot resulted from the addition of K10, K10/proK10, K10/proK10/K14, and K10/proK10/K14/proK14.
