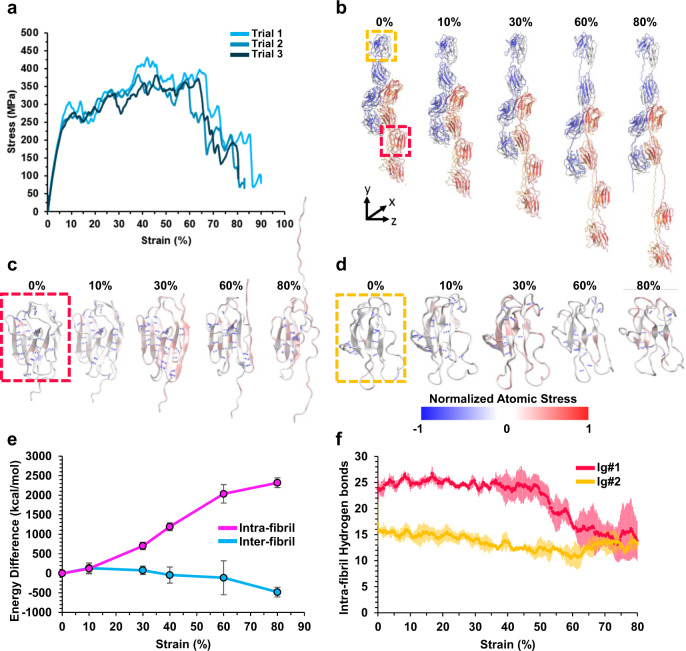
Fig. 4. Molecular dynamics simulation of uniaxial tensile testing of a model titin fiber.
a Representative uniaxial tensile stress-strain curves of the model titin fiber. b Snapshots of the molecular dynamics simulation of the titin fiber under tensile deformation. c, d Normalized atomic stress along the y-axis during extension of the titin fiber from 0 to 80% strain. Selected Ig-like domains are shown in dashed boxes. The Ig-like domain in the red and yellow boxes in (b) are shown in (c, d), respectively. e Average changes in intra- and inter-fibril (pink and blue, respectively) non-bonded energies (including Van der Waals, electrostatic, and hydrogen bonds) over the course of the simulation. Error bars are the standard deviation of three trials. f Average total number of intra-fibril backbone-backbone hydrogen bonds in the two selected Ig-like domains in (b–d) over the course of the tensile test. Error bars (shown as red or yellow bars) are the standard deviation of three trials. Source data are provided as a Source Data file.

