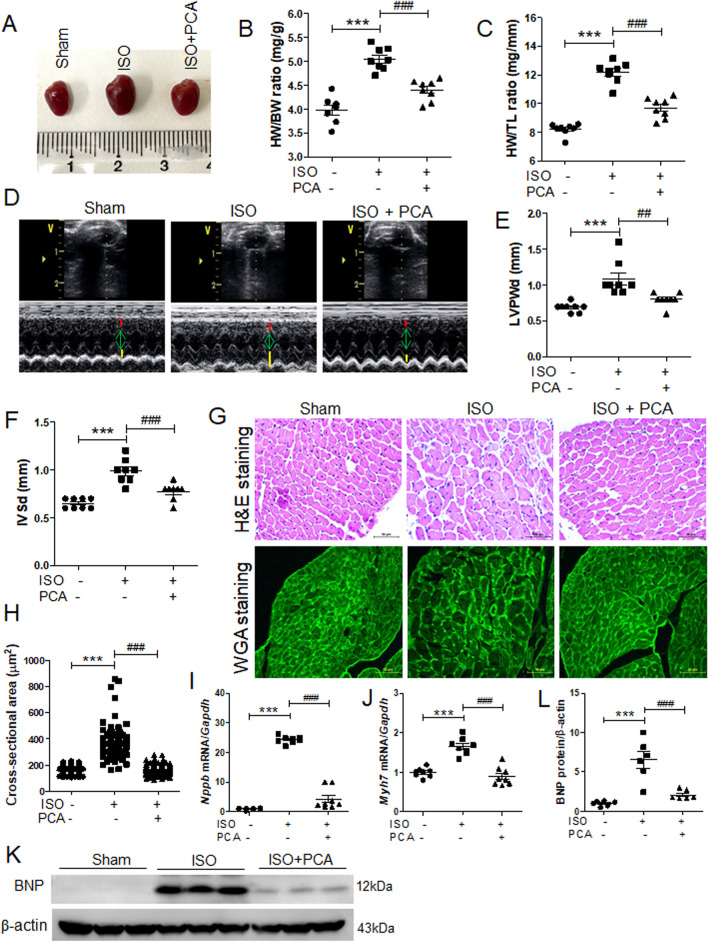
Figure 2.
Protocatechuic acid attenuates isoproterenol-induced cardiac hypertrophy in vivo. (A) Representative images of gross hearts from sham, isoproterenol, and isoproterenol + protocatechuic acid treated mice. (B,C) Heart weight to body weight ratio (HW/BW) and heart weight to tibia length ratio (HW/TL) of the mice described in (A) (n = 8). ***P < 0.001; ###P < 0.001. (D) Representative B-mode and M-mode echocardiograms are shown. Cardiac hypertrophy was determined by echocardiography after 5 days of isoproterenol administration. (E,F) Left ventricular posterior wall thickness (LVPWd, mm) and interventricular septum thickness (IVSd, mm) in mice (n = 8). ***P < 0.001; ##P < 0.01 and ###P < 0.001. ISO, isoproterenol; PCA, protocatechuic acid. (G) Representative images of H&E (upper panel) and wheat germ agglutinin (WGA, lower panel) staining of left ventricle papillary muscle from sham, isoproterenol, and isoproterenol + protocatechuic acid-treated mice. Scale bar = 50 μm. (H) Cross-sectional area quantification of H&E-stained hearts described in (G), n = 161 cells. ***P < 0.001; ###P < 0.001. (I,J) Total RNA was isolated from the hearts of mice (n = 8). mRNA levels of Nppb (I) and Myh7 (J) were determined by RT-PCR and normalized to Gapdh. ***P < 0.001; ###P < 0.001. (K,L) Representative Western blot images of BNP and quantification (n = 6); β-actin was used as a loading control. ***P < 0.001; ###P < 0.001. Data are presented as the mean ± S.E. Statistical analysis: one-way ANOVA followed by Bonferroni post hoc tests. Graphs were prepared using GraphPad 5.0.

