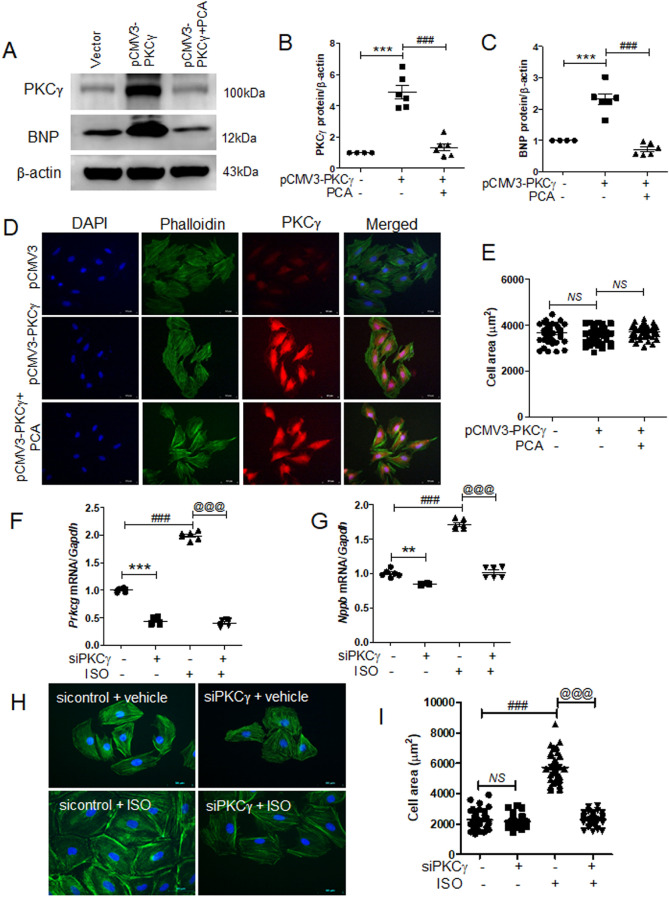
Figure 7.
PKCγ knockdown reduces isoproterenol-induced cardiac hypertrophy in H9c2 cells. (A‒E) H9c2 cells were transfected with empty vector or pCMV3-N-GFPSpark-PKCγ and then treated with protocatechuic acid (10 μM). (A) Representative western blot images showing PKCγ and BNP protein levels in pCMV3-N-GFPSpark-PKCγ-transfected cells. β-actin was used as a loading control. (B,C) Quantification of PKCγ and BNP protein levels (n = 6). ***P < 0.001; ###P < 0.001. (D,E) Representative images of cells transfected with pCMV3-N vector or pCMV3-N-GFPSpark-PKCγ, incubated with or without protocatechuic acid (10 μM), and then stained with anti-PKCγ antibody, Alexa Fluor 488 phalloidin, and DAPI. PKCγ-positive cells (red); nuclei (blue); actin filaments (green). Scale bar = 50 μm. (F,G) H9c2 cells were transfected with control or PKCγ siRNA, serum starved overnight, and then treated with isoproterenol (10 μM). The mRNA levels of Prkcg and Nppb were determined by RT-PCR (n = 6). **P < 0.01 and ***P < 0.001; ###P < 0.001; @@@P < 0.001. (I) Merged images of H9c2 cells transfected with PKCγ siRNA, incubated with or without isoproterenol (10 μM) for 24 h, and then stained with Alexa Fluor 488 phalloidin (green) and DAPI (blue). (J) Cell size was quantified by measuring the cell surface area of Alexa Fluor 488 phalloidin-stained cells (n = 40 cells). Scale bar = 50 μm. ###P < 0.001; @@@P < 0.001; NS not significant. Data are presented as the mean ± S.E. Statistical analysis: one-way ANOVA followed by Bonferroni post hoc tests. Graphs were prepared using GraphPad 5.0.

