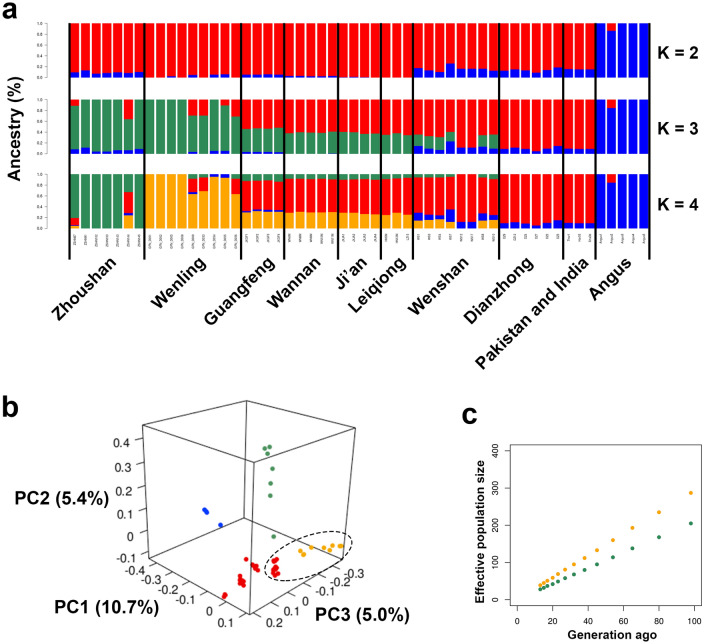
Figure 2.
Admixture and principal component analysis of Zhoushan cattle and other cattle breeds. (a) Admixture plot (K = 2, 3, 4) for the 54 cattle individuals. Each individual is shown as a vertical bar divided into K colours. (b) PCA plot showing the genetic structure of the 54 cattle individuals. The degree of explained variance is given in parentheses. Colours reflect the geographic regions of sampling in Fig. 1d. The cluster composed of cattle in Wenling, Guangfeng, Wannan, Ji'an, and Leiqiong is highlighted in the black dotted ellipse. (c) Estimate of the effective population sizes of Zhoushan (green) and Wenling (orange) cattle over the past 100 generations.

